Programmatically Interact with Gauge Band Colors
You can programmatically change Airspeed Indicator, EGT
Indicator, and RPM Indicator gauge band colors using the
ScaleColors property. When used with
get_param, this property returns an n-by-1
structure containing these elements, where n is the number of colored
bands on the gauge:
Min — Minimum value range for a color band
Max — Maximum value range for a color band
Color — RGB color triplet for a band (range from 0 to 1)
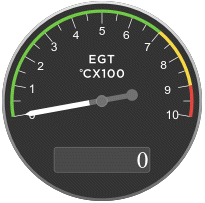
This example describes how to change a color band of the EGT Indicator gauge. By default, the EGT Indicator gauge looks like this.

This gauge has three bands, clockwise 1, 2, and 3.
Create a blank model and add an EGT Indicator block.
Select the EGT Indicator block.
To change the color bands for the EGT Indicator gauge, get the handle of the scale color objects.
sc=get_param(gcb,'ScaleColors')sc = 3×1 struct array with fields: Min Max ColorTo see the values of the
Min,Max, andColorvalues, use theschandle. For example, to see the values of the first band,sc(1), type:sc(1)
sc(1)

ans =

  struct with fields:

      Min: 0
      Max: 700
    Color: [0.2980 0.7333 0.0902]
To change the color and size of this band, define a structure with different
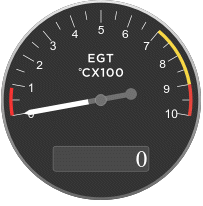
Min,Max, andColorvalues and setScaleColorsto that new structure. For example, to change the band range to 1 to 89 and the color to red:sc(1) = struct('Min',1,'Max',89,'Color',[1 0 0]); set_param(gcb,'ScaleColors',sc)
Observe the change in the EGT Indicator gauge.

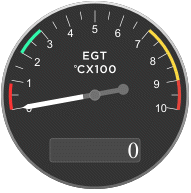
You can add and change as many color bands as you need. For example, to add a fourth band and set up the gauge with that band:
sc(4) = struct('Min',200,'Max',300,'Color',[0 1 .6]);
set_param(gcb,'ScaleColors',sc)

See Also
Airspeed Indicator | Exhaust Gas Temperature (EGT) Indicator | Revolutions Per Minute (RPM) Indicator