Main Content

replace

Replace polar plot data with new data

Description

example

replace(p,data) removes all data from polar plot p and adds new data based on real amplitude values, data.

replace(p,angle,magnitude) removes all the current data and adds new data sets of angle vectors and corresponding magnitude matrices to the polar plot p.

Examples

collapse all

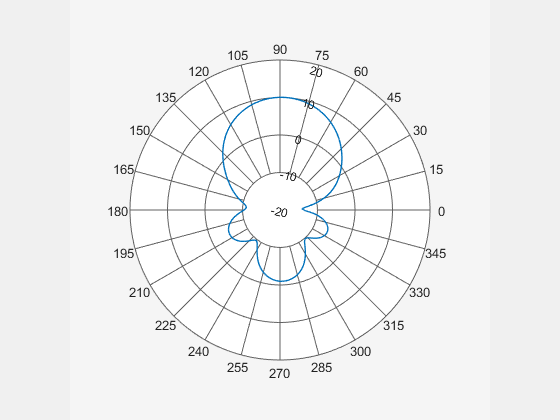
Create a helix antenna that has a 28 mm radius, a 1.2 mm width, and 4 turns. Calculate the directivity of the antenna at 1.8 GHz.

hx = helix(Radius=28e-3, Width=1.2e-3, Turns=4);
H = pattern(hx,1.8e9,0,0:1:360);

Plot the polar pattern.

P = polarpattern(H);

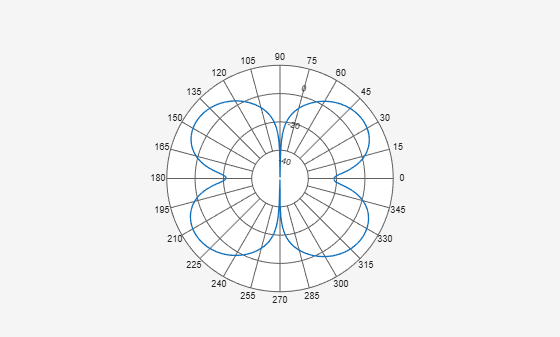
Create a dipole antenna and calculate its directivity at 270 MHz.

d = dipole;
D = pattern(d,270e6,0,0:1:360);

Replace the existing polar plot of the helix antenna with the directivity of the dipole.

replace(P,D);

Input Arguments

collapse all

Polar plot, specified as a polarpattern object.

Example: polarpattern

Antenna or array data, specified as one of the following:

  • A real length-M vector, where M contains the magnitude values with angles assumed to be (0:M1)M×360 degrees.

  • A real M-by-N matrix, where M contains the magnitude values and N contains the independent data sets. Each column in the matrix has angles taken from the vector (0:M1)M×360 degrees. The set of each angle can vary for each column.

  • A real N-D array, where N is the number of dimensions. Arrays with dimensions 2 and greater are independent data sets.

  • A complex vector or matrix, where data contains Cartesian coordinates ((x,y) of each point. x contains the real part of data and y contains the imaginary part of data.

When data is in a logarithmic form such as dB, magnitude values can be negative. In this case,polarpattern plots the lowest magnitude values at the origin of the polar plot and highest magnitude values at the maximum radius.

Example: pattern(dipole,70e6)

Set of angles, specified as a vector in degrees.

Set of magnitude values, specified as a vector or a matrix. For a matrix of magnitude values, each column is an independent set of magnitude values and corresponds to the same set of angles.

Version History

Introduced in R2016a