Main Content

openl3Preprocess

Preprocess audio for OpenL3 feature extraction

Since R2021a

    Description

    features = openl3Preprocess(audioIn,fs) generates spectrograms from audioIn that can be fed to the OpenL3 pretrained network.

    example

    features = openl3Preprocess(audioIn,fs,Name=Value) specifies options using one or more name-value arguments. For example, features = openl3Preprocess(audioIn,fs,OverlapPercentage=75) applies a 75% overlap between consecutive frames used to generate the spectrograms.

    [features,cf,ts] = openl3Preprocess(___) also returns the center frequencies of the bands and the time locations of the windows in the generated spectrograms.

    example

    Examples

    collapse all

    Use openl3Preprocess to extract embeddings from an audio signal.

    Read in an audio signal.

    [audioIn,fs] = audioread("Counting-16-44p1-mono-15secs.wav");

    To extract spectrograms from the audio, call the openl3Preprocess function with the audio and sample rate. Use 50% overlap and set the spectrum type to linear. The openl3Preprocess function returns an array of 30 spectrograms produced using an FFT length of 512.

    features = openl3Preprocess(audioIn,fs,OverlapPercentage=50,SpectrumType="linear");
    [posFFTbinsOvLap50,numHopsOvLap50,~,numSpectOvLap50] = size(features)
    posFFTbinsOvLap50 = 257
    
    numHopsOvLap50 = 197
    
    numSpectOvLap50 = 30
    

    Call openl3Preprocess again, this time using the default overlap of 90%. The openl3Preprocess function now returns an array of 146 spectrograms.

    features = openl3Preprocess(audioIn,fs,SpectrumType="linear");
    [posFFTbinsOvLap90,numHopsOvLap90,~,numSpectOvLap90] = size(features)
    posFFTbinsOvLap90 = 257
    
    numHopsOvLap90 = 197
    
    numSpectOvLap90 = 146
    

    Visualize one of the spectrograms at random.

    randSpect = randi(numSpectOvLap90);
    viewRandSpect = features(:,:,:,randSpect);
    N = size(viewRandSpect,2); 
    binsToHz = (0:N-1)*fs/N;
    nyquistBin = round(N/2);
    semilogx(binsToHz(1:nyquistBin),mag2db(abs(viewRandSpect(1:nyquistBin))))
    xlabel("Frequency (Hz)")
    ylabel("Power (dB)");
    title([num2str(randSpect),"th Spectrogram"])
    axis tight
    grid on

    Figure contains an axes object. The axes object with title 19 th Spectrogram, xlabel Frequency (Hz), ylabel Power (dB) contains an object of type line.

    Create an OpenL3 network using the same SpectrumType.

    net = audioPretrainedNetwork("openl3",SpectrumType="linear");

    Extract and visualize the audio embeddings.

    embeddings = predict(net,features);
    surf(embeddings,EdgeColor="none")
    view([90,-90])
    axis([1 numSpectOvLap90 1 numSpectOvLap90])
    xlabel("Embedding Length")
    ylabel("Spectrum Number")
    title("OpenL3 Feature Embeddings")
    axis tight

    Figure contains an axes object. The axes object with title OpenL3 Feature Embeddings, xlabel Embedding Length, ylabel Spectrum Number contains an object of type surface.

    Read in an audio signal

    [audioIn,fs] = audioread("SpeechDFT-16-8-mono-5secs.wav");

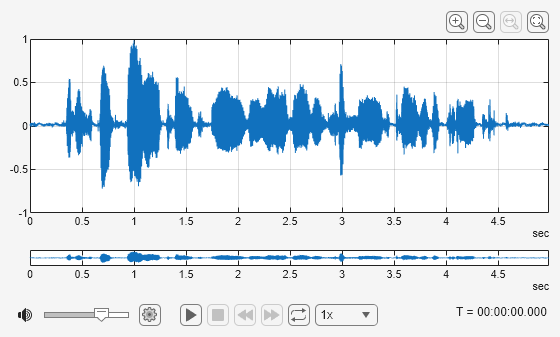
    Use audioViewer to visualize and listen to the audio.

    audioViewer(audioIn,fs)

    Figure Audio Viewer contains an object of type uiaudioplayer.

    Use openl3Preprocess to generate spectrograms that can be fed to the OpenL3 pretrained network. Specify additional outputs to get the center frequencies of the bands and the locations of the windows in time.

    [spectrograms,cf,ts] = openl3Preprocess(audioIn,fs);

    Choose a random spectrogram from the input to visualize. Use the center frequency and time location information to label the axes.

    spectIdx = randi(size(spectrograms,4));
    randSpect = spectrograms(:,:,1,spectIdx)';
    surf(cf/1000,ts(:,spectIdx),randSpect,EdgeColor="none")
    view([90 -90])
    xlabel("Frequency (kHz)")
    ylabel("Time (s)")
    axis tight

    Figure contains an axes object. The axes object with xlabel Frequency (kHz), ylabel Time (s) contains an object of type surface.

    Input Arguments

    collapse all

    Input signal, specified as a column vector or matrix. If you specify a matrix, openl3Preprocess treats the columns of the matrix as individual audio channels.

    Data Types: single | double

    Sample rate of the input signal in Hz, specified as a positive scalar.

    Data Types: single | double

    Name-Value Arguments

    Specify optional pairs of arguments as Name1=Value1,...,NameN=ValueN, where Name is the argument name and Value is the corresponding value. Name-value arguments must appear after other arguments, but the order of the pairs does not matter.

    Before R2021a, use commas to separate each name and value, and enclose Name in quotes.

    Example: openl3Preprocess(audioIn,fs,'SpectrumType','mel256')

    Percentage overlap between consecutive spectrograms, specified as a scalar in the range [0,100).

    Data Types: single | double

    Spectrum type generated from audio and used as input to the neural network, specified as one of these:

    • 'mel128' –– Generates mel spectrograms using 128 mel bands.

    • 'mel256' –– Generates mel spectrograms using 256 mel bands.

    • 'linear' –– Generates positive one-sided spectrograms using an FFT length of 512.

    Data Types: char | string

    Output Arguments

    collapse all

    Spectrograms generated from audioIn, returned as an N-by-M-by-1-by-K array.

    When you specify 'SpectrumType' as one of these:

    • 'mel128' –– The dimensions are 128-by-199-by-1-by-K, where 128 is the number of mel bands and 199 is the number of time hops.

    • 'mel256' –– The dimensions are 256-by-199-by-1-by-K, where 256 is the number of mel bands and 199 is the number of time hops.

    • 'linear' –– The dimensions are 257-by-197-by-1-by-K, where 257 is the positive one-sided FFT length and 197 is the number of time hops.

    • K represents the number of spectrograms and depends on the length of audioIn, the number of channels in audioIn, as well as OverlapPercentage.

    Data Types: single

    Center frequencies of the spectrogram in Hz, returned as a row vector with length depending on the spectrum type:

    • mel128 –– 128

    • mel256 –– 256

    • linear –– 257

    Time location of the center of each analysis window of audio in seconds, returned as an N-by-K matrix where N corresponds to the number of time hops and K corresponds to the number of spectrograms in features. For multichannel inputs, the time stamps are stacked along the second dimension.

    References

    [1] Cramer, Jason, et al. "Look, Listen, and Learn More: Design Choices for Deep Audio Embeddings." In ICASSP 2019 IEEE International Conference on Acoustics, Speech and Signal Processing (ICASSP), IEEE, 2019, pp. 3852-56. DOI.org (Crossref), doi:/10.1109/ICASSP.2019.8682475.

    Extended Capabilities

    C/C++ Code Generation
    Generate C and C++ code using MATLAB® Coder™.

    Version History

    Introduced in R2021a

    expand all