Main Content

speechTransmissionIndex

R2026b

Measure channel ability to transmit intelligible speech

Since R2026a

    Description

    sti = speechTransmissionIndex(ir,fs) returns the full indirect speech transmission index (STI) according to IEC 60268-16:2020 [1]. STI measures how well a channel transmits speech for intelligibility.

    example

    sti = speechTransmissionIndex(processed,reference,fs) returns the direct STI according to IEC 60268-16:2020. The processed-reference pair can either be the Speech Transmission Index for Public Address (STIPA) signal or the 98-signal full method.

    example

    [sti,mti] = speechTransmissionIndex(___) also returns the modulation transfer index (MTI) for each octave band.

    [sti,mti,mtf] = speechTransmissionIndex(___) also returns the uncorrected modulation transfer function (MTF).

    example

    [___] = speechTransmissionIndex(___,Name=Value) specifies options using one or more name-value arguments.

    example

    speechTransmissionIndex(___) without any output arguments plots the uncorrected MTF and displays the STI and MTI. If the inputs are multichannel, the function only displays the first channel.

    example

    Examples

    collapse all

    Load the impulse response and sample rate from an existing audio file.

    [ir,fs] = audioread("ChurchImpulseResponse-16-44p1-mono-5secs.wav");

    Calculate the speech transmission index (STI) using the full indirect method.

    sti = speechTransmissionIndex(ir,fs)
    sti = 
    0.4792
    

    Simulate the impulse response of a room using acousticRoomResponse.

    fs = 48e3;
    roomDimensions = [50,80,15];
    tx = [25,2,5];
    rx = [25,4,2];
    ir = acousticRoomResponse(roomDimensions,tx,rx,...
        SampleRate=fs,ImageSourceOrder=6,...
        MaxNumRayReflections=50,NumStochasticRays=4000);

    Generate the speech transmission index for public address (STIPA) excitation signal using stipaExcitation.

    x = stipaExcitation(fs);

    Model a real-world measurement by filtering the excitation signal through the impulse response.

    y = fftfilt(ir',x);

    Calculate STIPA using speechTransmissionIndex.

    sti = speechTransmissionIndex(y,x,fs)
    sti = 
    0.6188
    

    To apply ambient noise correction to the speech transmission index (STI) calculation, you need to measure both the acoustic level of the test signal and the background noise. Use the indirect method if the signal level and impulse response were measured separately.

    Load the impulse response and sample rate from an existing audio file.

    [ir,fs] = audioread("ChurchImpulseResponse-16-44p1-mono-5secs.wav");

    The IEC 60268-16:2020 standard recommends specific speech levels for each of the seven octave bands representing typical male speech, so that their combined level is 60 dB A-weighted.

    standardSignalLevel = 60 + [-2.5 0.5 0 -6 -12 -18 -24];

    Confirm the signal level corresponds to a 60 dB A-weighted signal.

    standardSignalIntensity = db2pow(standardSignalLevel);
    aWeighting = db2pow([-16.1 -8.6 -3.2 0 1.2 1 -1.1]);
    pow2db(sum(aWeighting.*standardSignalIntensity))
    ans = 
    60.0205
    

    To simulate a condition with a raised vocal effort, set the A-weighted speech level to 70 dB. These values are from a study that amended the standard typical male speech spectrum [2].

    raisedSignalLevel = [67.3 70.3 69.6 63.6 57.6 51.6 45.6];

    Confirm the raised level corresponds to a 70 dB A-weighted signal.

    raisedSignalIntensity = db2pow(raisedSignalLevel);
    pow2db(sum(aWeighting.*raisedSignalIntensity))
    ans = 
    69.6547
    

    Calculate the STI for both the standard and raised speaking levels by using the OperationalSignalLevel name-value argument. The STI for the raised speaking voice is higher than the standard speaking voice.

    standardSTI = speechTransmissionIndex(ir,fs,OperationalSignalLevel=standardSignalLevel)
    standardSTI = 
    0.4792
    
    raisedSTI = speechTransmissionIndex(ir,fs,OperationalSignalLevel=raisedSignalLevel)
    raisedSTI = 
    0.5078
    

    Simulate the impulse response of three positions in a room with a fixed transmitter position.

    fs = 48000;
    roomDimensions = [50,80,15];
    tx = [25,2,5]; % front of room
    rx1 = [25,4,2]; % center, front
    rx2 = [10,40,2]; % left, middle
    rx3 = [28,70,2]; % off-center, back
    ir1 = acousticRoomResponse(roomDimensions,tx,rx1,SampleRate=fs,...
        ImageSourceOrder=5,MaxNumRayReflections=25,NumStochasticRays=2000);
    ir2 = acousticRoomResponse(roomDimensions,tx,rx2,SampleRate=fs,...
        ImageSourceOrder=5,MaxNumRayReflections=25,NumStochasticRays=2000);
    ir3 = acousticRoomResponse(roomDimensions,tx,rx3,SampleRate=fs,...
        ImageSourceOrder=5,MaxNumRayReflections=25,NumStochasticRays=2000);

    Create a matrix of impulse responses with one column per response.

    maxLength = max([length(ir1),length(ir2),length(ir3)]);
    multiIR = [paddata(ir1,maxLength)',paddata(ir2,maxLength)',paddata(ir3,maxLength)'];

    Calculate the speech transmission index of each impulse response.

    sti = speechTransmissionIndex(multiIR,fs)
    sti = 1×3
    
        0.6284    0.4265    0.4546


    Load the impulse response and sample rate from an existing audio file.

    [ir,fs] = audioread("ChurchImpulseResponse-16-44p1-mono-5secs.wav");

    Compare the speech transmission index of the impulse response at different operational noise levels using noise criteria curves.

    sti = speechTransmissionIndex([ir,ir,ir],fs,OperationalNoiseLevel=["NC-40","NC-45","NC-50"])
    sti = 1×3
    
        0.4413    0.3789    0.2885


    Load the impulse response and sample rate from an existing audio file.

    [ir,fs] = audioread("ChurchImpulseResponse-16-44p1-mono-5secs.wav");

    Calculate the speech transmission index (STI), modulation transfer index (MTI), and modulation transfer function (MTF).

    [sti,mti,mtf] = speechTransmissionIndex(ir,fs)
    sti = 
    0.4792
    
    mti = 1×7 table
          125       250        500       1000       2000       4000       8000  
        _______    ______    _______    _______    _______    _______    _______
    
        0.23679    0.2767    0.39191    0.46925    0.53377    0.57021    0.52277
    
    
    mtf = 14×7 table
                  125         250         500       1000       2000       4000       8000  
                ________    ________    _______    _______    _______    _______    _______
    
        0.63     0.53326     0.53476    0.58379     0.6637    0.75643     0.8541    0.94291
        0.8      0.47081     0.46602    0.50007    0.60231    0.70411    0.81263    0.91801
        1        0.41848     0.39282    0.42025    0.54126     0.6568    0.77004    0.88643
        1.25     0.36372     0.30972    0.35542    0.48247    0.61687    0.73048    0.84927
        1.6      0.28554     0.22537    0.29849    0.43454    0.58553    0.69813    0.80911
        2        0.18122     0.13482    0.25023    0.40107    0.56226    0.67173    0.76941
        2.5      0.12269     0.14755    0.24224    0.37902    0.54325    0.65261    0.73321
        3.15     0.14069      0.1435    0.28479    0.41172    0.53038    0.64377    0.70414
        4        0.10554    0.097203    0.29454    0.41365    0.53862    0.64385    0.68115
        5       0.049324     0.12636    0.26394    0.43722    0.54322    0.65395    0.66781
        6.3      0.20993     0.17308    0.35553     0.4005      0.552    0.66281    0.66887
        8        0.21814     0.10417    0.23267    0.42406    0.52152    0.64389    0.65192
        10      0.043357    0.055335    0.30427    0.38937    0.50608    0.64095    0.64827
        12.5     0.10681    0.076817    0.24498    0.39135    0.48466    0.64566    0.63223


    Plot the uncorrected MTF by calling speechTransmissionIndex with no output arguments. The convenience plot also displays the STI and MTI for each octave band.

    speechTransmissionIndex(ir,fs)
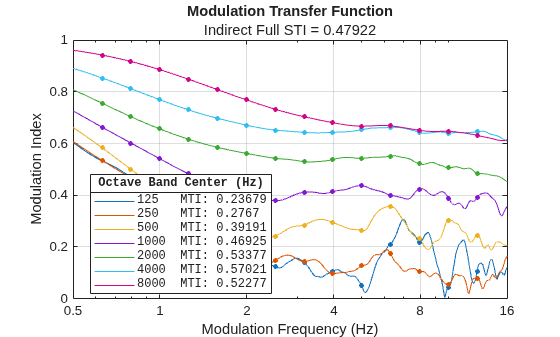
    Figure contains an axes object. The axes object with title Modulation Transfer Function, xlabel Modulation Frequency (Hz), ylabel Modulation Index contains 14 objects of type line. One or more of the lines displays its values using only markers These objects represent 125 MTI: 0.23679, 250 MTI: 0.2767, 500 MTI: 0.39191, 1000 MTI: 0.46925, 2000 MTI: 0.53377, 4000 MTI: 0.57021, 8000 MTI: 0.52277, 125, 250, 500, 1000, 2000, 4000, 8000.

    Input Arguments

    collapse all

    Impulse response to use to calculate the full indirect STI, specified as a column vector, row vector, or matrix. The impulse response must either be noiseless or have a signal-to-noise ratio (SNR) greater than or equal to 20 dB. Before the STI computation, the function subtracts the mean of the impulse response to remove any DC components introduced by the signal measurement chain.

    When you specify a matrix, the function interprets the smaller dimension as the channel dimension. Each channel must contain an independent impulse response.

    Data Types: single | double

    Sample rate in Hz, specified as a scalar equal to or greater than 16 kHz.

    Data Types: single | double

    Received signal to use to calculate the modulation transfer ratio, specified as a column vector, matrix, or N-by-14-by-7 array. If you specify processed as a column vector (STIPA signal) or N-by-14-by-7 arrays (full STI, where N is the length of the signal), reference must match the dimensions of processed or be a scalar.

    If you specify processed as a matrix (STIPA signal), the function interprets each column as an independent channel. In this case, reference must be one of the following:

    • A vector with the same length as processed for a shared reference signal.

    • A matrix with the same dimensions as processed for separate reference signals.

    • A scalar corresponding to modulation depth for all channels of processed.

    IEC 60268-16:2020 [1] prefers noise-free measurements when possible. A measurement can be considered noise-free when the SNR is equal to or greater than 20 dB for all octave bands with center frequencies 125, 250, 500, 1000, 2000, 4000, and 8000 Hz. To remove ambient noise from raw signals, specify RawSignalLevel and RawNoiseLevel.

    Data Types: single | double

    Transmitted signal to use as a reference calculate the modulation transfer ratio, specified as a column vector, matrix, or N-by-14-by-7 array. If you specify reference as a column vector (STIPA signal) or N-by-14-by-7 arrays (full STI, where N is the length of the signal), reference must match the dimensions of processed or be a scalar.

    If you specify processed as a matrix (STIPA signal), the function interprets each column as an independent channel. In this case, reference must be one of the following:

    • A vector with the same length as processed for a shared reference signal.

    • A matrix with the same dimensions as processed for separate reference signals.

    • A scalar corresponding to modulation depth for all channels of processed.

    Use stipaExcitation to generate either Direct STIPA or Direct Full STI signals. For IEC 60268-16:2020 [1] compliance, follow the procedure described in section 8.2 of the standard.

    Data Types: single | double

    Name-Value Arguments

    collapse all

    Specify optional pairs of arguments as Name1=Value1,...,NameN=ValueN, where Name is the argument name and Value is the corresponding value. Name-value arguments must appear after other arguments, but the order of the pairs does not matter.

    Example: speechTransmissionIndex(ir,fs,AddOperationalAmbientNoise=false)

    Signal level at measurement time, specified as a 1-by-7 row vector or a C-by-7 matrix, where C is the number of channels. Each column corresponds to the measured level for octave bands with center frequencies 125, 250, 500, 1000, 2000, 4000, and 8000 Hz. If you specify ir or processed with multiple channels and RawSignalLevel with one channel, the function applies RawSignalLevel to all channels.

    Record the signal level at the same time you measure ir, processed, or reference. If you specify RawSignalLevel, you must also specify RawNoiseLevel.

    Data Types: single | double

    Noise level near measurement time, specified as a 1-by-7 row vector or a C-by-7 matrix, where C is the number of channels. Each column corresponds to the measured level for octave bands with center frequencies 125, 250, 500, 1000, 2000, 4000, and 8000 Hz. If you specify ir or processed with multiple channels and RawNoiseLevel with one channel, the function applies RawNoiseLevel to all channels.

    Record the noise level measurement in the same scenario as the measurements and RawSignalLevel, but without the signal transmission. If you specify RawNoiseLevel, you must also specify RawSignalLevel.

    Data Types: single | double

    Option to remove ambient noise contributions from audio signal, specified as true, false, or a C-element logical vector. When you specify RemoveRawAmbientNoise as a logical scalar, the value applies to all channels. When you specify RemoveRawAmbientNoise as a logical vector, C must be equal to the number of channels. In this case, the function applies each element to the corresponding channel.

    A measurement is considered noise free when the SNR is equal to or greater than 20 dB for all octave bands with center frequencies 125, 250, 500, 1000, 2000, 4000, and 8000 Hz. To remove ambient noise, you must also specify RawSignalLevel and RawNoiseLevel.

    Data Types: logical

    Option to remove auditory masking and threshold effects from audio signal, specified as true, false, or a C-element logical vector. When you specify RemoveRawAuditoryContributions as a logical scalar, the value applies to all channels. When you specify RemoveRawAuditoryContributions as a logical vector, C must be equal to the number of channels. In this case, the function applies each element to the corresponding channel.

    A measurement is considered noise free when the SNR is equal to or greater than 20 dB for all octave bands with center frequencies 125, 250, 500, 1000, 2000, 4000, and 8000 Hz. To remove auditory contributions from raw signals, you must also specify RawSignalLevel and RawNoiseLevel.

    Data Types: logical

    Signal level in dB, specified as a 1-by-7 row vector or a C-by-7 matrix. Each column corresponds to the measured or expected noise level for each octave band. If you do not specify this argument, the speech level corresponds to a 60 dB A-weighted typical male speech level (see IEC 60268-16:2020 [1]). If you specify ir or processed with multiple channels and OperationalSignalLevel with one channel, the function applies OperationalSignalLevel to all channels.

    Data Types: single | double

    Noise level in dB, specified as the name of a noise criteria curve or as octave band sound pressure level measurements. If you specify this argument as a string or a C-element vector of strings, the function selects background noise levels based on the corresponding noise criteria curves (for more information, see noiseCriteria). Valid strings are:

    • "NC-X", where X is an integer between 15 and 70 (inclusive).

    • "RNC-X" where X is an integer between 10 and 70 (inclusive).

    • "RC-X", where X is an integer between 25 and 50 (inclusive).

    When you specify OperationalNoiseLevel as a 1-by-7 row vector or a C-by-7 matrix, where C is the number of channels, each column corresponds to the measured noise level for octave bands with center frequencies 125, 250, 500, 1000, 2000, 4000, and 8000 Hz.

    If you specify ir or processed with multiple channels and OperationalNoiseLevel with one channel, the function applies OperationalNoiseLevel to all channels. If you do not specify this argument, the function uses background noise corresponding to the NC-35 rating. The NC-35 rating represents a relatively quiet indoor environment, such as a library.

    Data Types: single | double

    Option to add ambient noise contributions to MTF for operational signal and noise levels, specified as true, false, or a C-element logical vector. When you specify AddOperationalAmbientNoise as a logical scalar, the value applies to all channels. When you specify AddOperationalAmbientNoise as a logical vector, C must be equal to the number of channels. In this case, the function applies each element to the corresponding channel.

    When the value of AddOperationalAmbientNoise is true, the function adds ambient noise contributions to the MTF using OperationalSignalLevel and OperationalNoiseLevel. Before adjusting operational ambient noise, the MTF must correspond to a noiseless measurement. Either capture the signal under noiseless conditions or remove ambient noise with RemoveRawAmbientNoise and, if relevant, remove auditory masking and threshold effects with RemoveRawAuditoryContributions.

    Data Types: logical

    Option to add auditory masking and threshold effect contributions to MTF for operational signal and noise levels, specified as true, false, or a C-element logical vector. When you specify AddOperationalAuditoryContributions as a logical scalar, the value applies to all channels. When you specify AddOperationalAuditoryContributions as a logical vector, C must be equal to the number of channels. In this case, the function applies each element to the corresponding channel.

    When the value of AddOperationalAuditoryContributions is true, this function corrects the MTF using OperationalSignalLevel and OperationalNoiseLevel.

    Data Types: logical

    Output Arguments

    collapse all

    Speech transmission index (STI), returned as a scalar or a C-element row vector, where C is the number of input channels. STI values lie in the range [0,1]. The STI quantifies how the channel affects the speech signal. As the value increases from 0 to 1, the quality of speech transmission increases. For more information on how to interpret this value, see Interpreting Speech Transmission Index.

    Modulation transmission index (MTI), returned as a table or cell array with one table per channel. Table variables correspond to the octave band center frequencies 125, 250, 500, 1000, 2000, 4000, and 8000 Hz. The MTI represents the transmission quality for each octave band.

    Modulation transfer function (MTF), returned as a table or cell array with one table per channel. The MTF quantifies how individual modulation frequencies that cover the range of human speech are affected by the channel. The table size and variables depend on the method of analysis:

    • Full (Direct and Indirect) — 14 rows with row names corresponding to the modulation frequencies analyzed and seven columns with variables corresponding to the octave band center frequencies that carry the pink noise signals.

    • STIPA (Direct) — Two rows with row names f1 and f2 and seven columns with variables corresponding to the octave band center frequencies that carry the pink noise signals. This table describes the frequencies [1].

      Octave band center frequency, Hz1252505001000200040008000
      First modulation frequency, Hz1.601.000.632.001.250.802.50
      Second modulation frequency, Hz8.005.003.1510.06.254.0012.5

    More About

    collapse all

    Algorithms

    This diagram provides a high-level overview of the algorithm.

    References

    [1] IEC 60268-16:2020. "Sound system equipment — Part 16: Objective rating of speech intelligibility by speech transmission index." International Electrotechnical Commission.

    [2] Leembruggen, Glenn, et al. “The Effect on STI Results of Changes to the Male Test-Signal Spectrum.” Institute of Acoustics, vol. 38 pt. 2, 2016, pp. 78–87.

    Extended Capabilities

    expand all

    C/C++ Code Generation
    Generate C and C++ code using MATLAB® Coder™.

    Version History

    Introduced in R2026a

    expand all