Main Content

mspeaks

Convert raw peak data to peak list (centroided data)

Description

Peaklist = mspeaks(X,Intensities) finds relevant peaks in raw, noisy peak signal data, and creates Peaklist, a two-column matrix, containing the separation-axis value and intensity for each peak.

example

[Peaklist,PFWHH] = mspeaks(X,Intensities) also returns PFWHH, a two-column matrix indicating the left and right locations of the full width at half height (FWHH) markers for each peak. For any peak not resolved at FWHH, mspeaks returns the peak shape extents instead. When Intensities includes multiple signals, then PFWHH is a cell array of matrices.

[Peaklist,PFWHH,PExt] = mspeaks(X,Intensities) also returns PExt, a two-column matrix indicating the left and right locations of the peak shape extents determined after wavelet denoising. When Intensities includes multiple signals, then PExt is a cell array of matrices.

___ = mspeaks(X,Intensities,Name,Value), for any output variables, modifies the behavior of mspeaks using one or more Name=Value arguments. For example, obtain a plot of the original signal, smoothed signal, and calculated peaks using mspeaks(X,Intensities,ShowPlot=true).

example

Examples

collapse all

Load a MAT-file, included with the Bioinformatics Toolbox™ software, that contains two mass spectrometry data variables, MZ_lo_res and Y_lo_res. The first, MZ_lo_res, is a vector of m/z values for a set of spectra. The second, Y_lo_res, is a matrix of intensity values for a set of mass spectra that share the same m/z range.

load sample_lo_res

Adjust the baseline of the eight spectra stored in Y_lo_res by using msbackadj.

YB = msbackadj(MZ_lo_res,Y_lo_res);

Convert the raw mass spectrometry data to a peak list by finding the relevant peaks in each spectrum.

Peaklist = mspeaks(MZ_lo_res,YB);

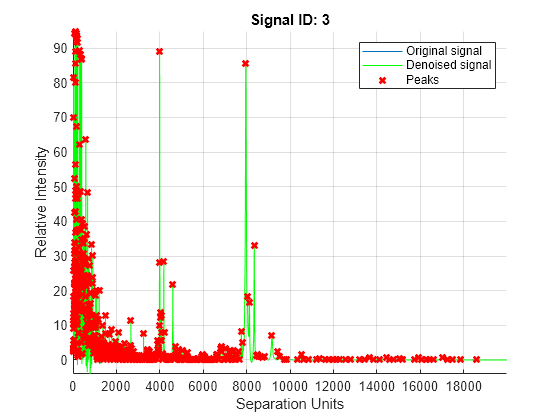
Plot the third spectrum in YB, the matrix of baseline-corrected intensity values, with the detected peaks marked.

Peaklist = mspeaks(MZ_lo_res,YB,ShowPlot=3);

Figure contains an axes object. The axes object with title Signal ID: 3, xlabel Separation Units, ylabel Relative Intensity contains 3 objects of type line. One or more of the lines displays its values using only markers These objects represent Original signal, Denoised signal, Peaks.

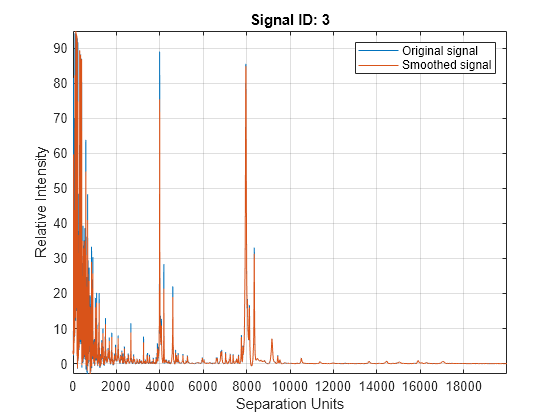
Smooth the signal using the mslowess function. Then convert the smoothed data to a peak list by finding relevant peaks and plot the third spectrum.

YS = mslowess(MZ_lo_res,YB,ShowPlot=3);

Figure contains an axes object. The axes object with title Signal ID: 3, xlabel Separation Units, ylabel Relative Intensity contains 2 objects of type line. These objects represent Original signal, Smoothed signal.

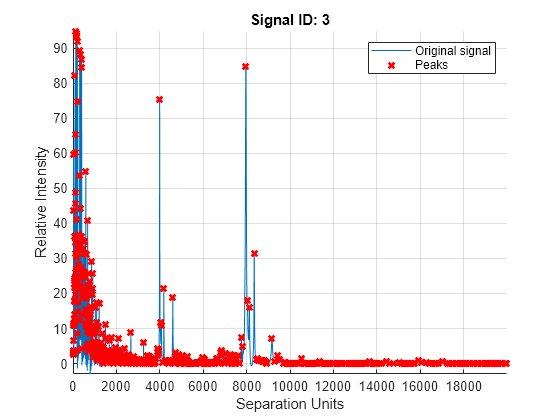
Peaklist = mspeaks(MZ_lo_res,YS,Denoising=false,ShowPlot=3);

Figure contains an axes object. The axes object with title Signal ID: 3, xlabel Separation Units, ylabel Relative Intensity contains 2 objects of type line. One or more of the lines displays its values using only markers These objects represent Original signal, Peaks.

Find the number of peaks in Peaklist.

numPeaks = numel(Peaklist)
numPeaks = 
8

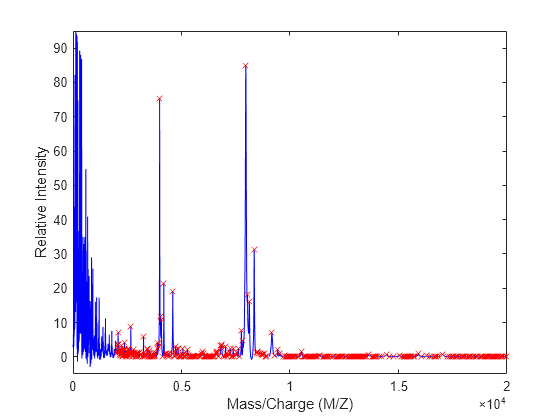
Use the cellfun function to remove all peaks with m/z values less than 2000 from the eight peaks listed in output Peaklist. Then plot the peaks of the third spectrum (in red) over its smoothed signal (in blue).

Q = cellfun(@(p) p(p(:,1)>2000,:),Peaklist,UniformOutput=false);
figure
plot(MZ_lo_res,YS(:,3),'b',Q{3}(:,1),Q{3}(:,2),'rx')
xlabel('Mass/Charge (M/Z)')
ylabel('Relative Intensity')
axis([0 20000 -5 95])

Figure contains an axes object. The axes object with xlabel Mass/Charge (M/Z), ylabel Relative Intensity contains 2 objects of type line. One or more of the lines displays its values using only markers

Input Arguments

collapse all

Data containing separation-unit values for a set of signals with peaks, specified as a numeric vector. The number of elements in the vector equals the number of rows in the matrix Intensities. The separation unit can quantify wavelength, frequency, distance, time, or m/z depending on the instrument that generates the signal data.

Data Types: double

Data containing intensity values for a set of peaks that share the same separation-unit range, specified as a numeric matrix. Each row corresponds to a separation-unit value, and each column corresponds to either a set of signals with peaks or a retention time. The number of rows equals the number of elements in vector X.

Data Types: double

Name-Value Arguments

Specify optional pairs of arguments as Name1=Value1,...,NameN=ValueN, where Name is the argument name and Value is the corresponding value. Name-value arguments must appear after other arguments, but the order of the pairs does not matter.

Example: Peaklist = mspeaks(X,Intensities,HeightFilter=10) specifies the reported peaks to have the minimum height of 10.

Wavelet base, specified as an integer from 2 through 20.

Example: 15

Data Types: double

Indication to use wavelet denoising to smooth the signal, specified as false (do not use denoising) or true (use denoising).

If your data was previously smoothed, for example, with the mslowess or mssgolay function, you do not need to use wavelet denoising. Set this property to false.

See Algorithms.

Example: true

Data Types: logical

Minimum full width at half height (FWHH), in separation units, for reported peaks, specified as a nonnegative scalar. Peaks with FWHH below this value are excluded from the output list Peaklist.

Example: 12

Data Types: double

Minimum height for reported peaks, specified as a nonnegative scalar.

Example: 15

Data Types: double

Number of levels for the wavelet decomposition, specified as an integer from 1 through 12.

Data Types: double

Threshold multiplier constant, specified as a positive scalar.

Example: 0.5

Data Types: double

Method to estimate the threshold, T, to filter out noisy components in the first high-band decomposition (y_h), specified as one of the following.

  • 'mad', which stands for Median Absolute Deviation. 'mad' calculates T = sqrt(2*log(n))*mad(y_h) / 0.6745, where n = the number of rows in the Intensities matrix.

  • 'std', which stands for Standard Deviation. 'std' calculates T = std(y_h).

  • A positive scalar value.

Example: 10

Data Types: double | char | string

Minimum distance, in separation units, between neighboring peaks, specified as a nonnegative scalar. When the signal is not smoothed appropriately, multiple maxima can appear to represent the same peak. Increase this filter value to join oversegmented peaks into a single peak.

Example: 10

Data Types: double

Proportion of the peak height to use to select the points to compute the centroid separation-axis value of the respective peak, specified as a scalar value from 0 through 1.

When PeakLocation = 1.0, the peak location is at the maximum of the peak. When PeakLocation = 0, mspeaks computes the peak location with all the points from the closest minimum to the left of the peak to the closest minimum to the right of the peak.

Example: 0.75

Data Types: double

Indication to plot, specified as false (do not plot), true (plot), or an integer specifying the index of a spectrum in Intensities. The plot shows the original signal and the smoothed signal, with the peaks included in the output matrix Peaklist marked. true gives the same result as 1, meaning true causes the first index in Intensities to be plotted.

Example: true

Data Types: double | logical

Style for marking peaks in plot, specified as one of the following:

  • 'peak' — Place a marker at the peak crest.

  • 'exttriangle' — Draw a triangle using the peak crest and the extents.

  • 'fwhhtriangle' — Draw a triangle using the peak crest and the FWHH points.

  • 'extline' — Place a marker at the peak crest and vertical lines at the extents.

  • 'fwhhline' — Place a marker at the peak crest and a horizontal line at FWHH.

Example: 'fwhhline'

Data Types: char | string

Output Arguments

collapse all

List of peaks, returned as a two-column matrix or cell array of matrices, where each matrix row corresponds to a peak. The first column contains separation-unit values (indicating the location of peaks along the separation axis). The second column contains intensity values. When Intensities includes multiple signals, Peaklist is a cell array of matrices, each containing a peak list.

Left and right locations of the full width at half height (FWHH) markers for each peak, returned as a two-column matrix or cell array of matrices. For any peak not resolved at FWHH, mspeaks returns the peak shape extents instead. When Intensities includes multiple signals, then PFWHH is a cell array of matrices.

Left and right locations of the peak shape extents determined after wavelet denoising, returned as a two-column matrix or cell array of matrices. When Intensities includes multiple signals, PExt is a cell array of matrices.

Algorithms

mspeaks converts raw peak data to a peak list (centroided data) by:

  1. Smoothing the signal using undecimated wavelet transform with Daubechies coefficients

  2. Assigning peak locations

  3. Estimating noise

  4. Eliminating peaks that do not satisfy specified criteria

References

[1] Morris, J.S., Coombes, K.R., Koomen, J., Baggerly, K.A., and Kobayash, R. (2005) Feature extraction and quantification for mass spectrometry in biomedical applications using the mean spectrum. Bioinfomatics 21:9, 1764–1775.

[2] Yasui, Y., Pepe, M., Thompson, M.L., Adam, B.L., Wright, G.L., Qu, Y., Potter, J.D., Winget, M., Thornquist, M., and Feng, Z. (2003) A data-analytic strategy for protein biomarker discovery: profiling of high-dimensional proteomic data for cancer detection. Biostatistics 4:3, 449–463.

[3] Donoho, D.L., and Johnstone, I.M. (1995) Adapting to unknown smoothness via wavelet shrinkage. J. Am. Statist. Asso. 90, 1200–1224.

[4] Strang, G., and Nguyen, T. (1996) Wavelets and Filter Banks (Wellesley: Cambridge Press).

[5] Coombes, K.R., Tsavachidis, S., Morris, J.S., Baggerly, K.A., Hung, M.C., and Kuerer, H.M. (2005) Improved peak detection and quantification of mass spectrometry data acquired from surface-enhanced laser desorption and ionization by denoising spectra with the undecimated discrete wavelet transform. Proteomics 5(16), 4107–4117.

Version History

Introduced in R2007a

Go to top of page