plot
R2026bPlot cfit or sfit object
Syntax
Description
Surfaces
plot(___,
specifies options using one or more name-value arguments in addition to any of
the input argument combinations in the previous syntaxes for surfaces. For
example, you can specify the type and limits of the plot.Name=Value)
Curves
plot(
specifies the color, marker symbol, and line style used to plot the scatter plot
data.cfit,x,y,DataLineSpec)
plot(
specifies the color, marker symbol, and line style that
cfit,FitLineSpec,x,y,DataLineSpec)plot uses to plot the curve given in
cfit.
plot(
specifies the color, marker symbol, and line style used to plot the
outliers.cfit,x,y,outliers,OutlierLineSpec)
plot(
specifies the color, marker symbol, and line style used to plot the curve,
scatter plot data, and outliers.cfit,FitLineSpec,x,y,DataLineSpec,outliers,OutlierLineSpec)
plot(___,
specifies the plot type using any of the input arguments combinations in the
previous syntaxes for curves.ptype)
Examples
Load the franke data set.
load frankeThe vectors x, y, and z contain data generated from Franke's bivariate test function.
Fit a Lowess smoothing model to the data in x, y, and z.
ls = fit([x,y],z,"lowess");ls is an sfit object that contains the results of fitting the Lowess smoothing model to the data.
Plot ls and change the view of the figure.
plot(ls)
view([19.5 40.0])
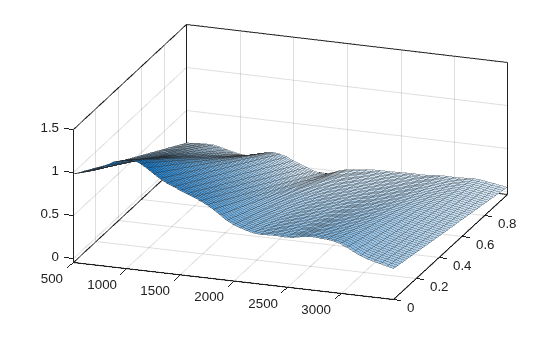
The plot shows that the Lowess smoothing fit is a wavy surface that lies between z=0 and z=1.5 across the values for x and y.
Load the titanium data set. Convert the data from row to column vectors.
[x, y] = titanium;
x = x';
y = y';
x contains temperature measurements and y contains measurements for a property of titanium.
Fit a Gaussian model to the x and y data.
g = fit(x,y,"gauss2");g is a cfit object that contains the results of fitting the Gaussian model to the data.
Plot g with a scatter plot of the data.
plot(g,x,y)
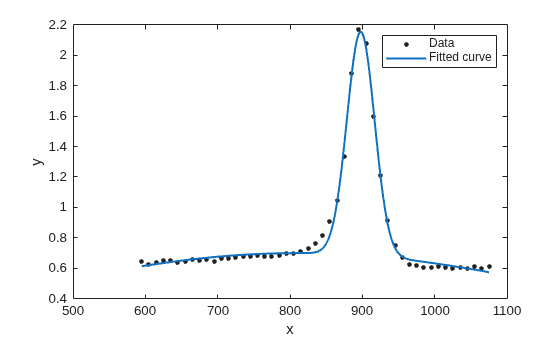
The plot shows that g closely follows the majority of the data, and the y data spikes when x is approximately 900.
Generate some data for a baseline sinusoidal signal using the linspace and sin functions.
xdata = linspace(0,2*pi,60)';
y0 = sin(xdata);
xdata is a vector of 60 points between 0 and 2, and y0 is a vector of values given by evaluating the sine function at the values in xdata.
Generate noise from a Gaussian distribution using the randn function.
rng(0,"twister") %  For reproducibility
gnoise = y0.*randn(size(y0));
To generate impulse noise, first use the randperm and round functions to create a vector of random indices.
leny0 = length(y0);
p = randperm(leny0);
stop = round(leny0/5);
idx = p(1:stop);
idx is a vector of integers representing the indices of y0.
Create a vector of impulse noise using the zeros function. Then, use the sign function to assign the values –5 and 5 to the noise vector at positions in idx where the elements of y0 are negative and positive, respectively.
szy = size(y0);
spnoise = zeros(szy);
yidx = y0(idx);
spnoise(idx) = 5*sign(yidx);
Add the noise vectors to y0.
ydata = y0 + gnoise + spnoise;
ydata is a vector of noisy data with nonconstant variance.
Fit a sinusoidal model to ydata.
f = fittype("a*sin(b*x)");
fit1 = fit(xdata,ydata,f,StartPoint=[1 1]);
fit1 contains the results of fitting a sinusoidal model using least-squares fitting.
Create a vector of outliers from the points in xdata and ydata that are more than 1.5 standard deviations away from the model in fit1.
fdata = feval(fit1,xdata);
outliers = abs(fdata - ydata) > 1.5*std(ydata);
Refit the data with the outliers excluded.
fit2 = fit(xdata,ydata,f,StartPoint=[1 1],...
           Exclude=outliers);
fit2 contains the results of fitting a sinusoidal model to the data with the outliers excluded.
Fit a third model using a robust fitting algorithm.
fit3 = fit(xdata,ydata,f,StartPoint=[1 1],Robust="on");fit3 contains the results of fitting a sinusoidal model to the data using the bisquare-weights fitting algorithm.
To compare the fitted models, plot the data, outliers, and results of the fits.
plot(fit1,xdata,ydata,outliers)
hold on
plot(fit2)
plot(fit3)
xlim([0 2*pi])
legend("data","outlier","fit1","fit2","fit3")
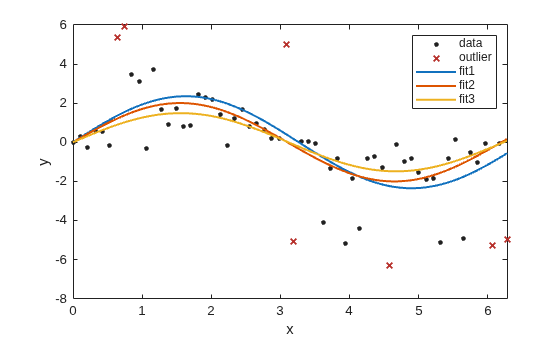
The plot shows each fit with a different line color. All three fits follow the bulk of the data. fit1 comes closer to the outliers than the other two fits.
Plot the residuals for fit1.
figure
plot(fit1,xdata,ydata,"residuals")
hold on
xlabel("xdata")
ylabel("residuals")
hold off
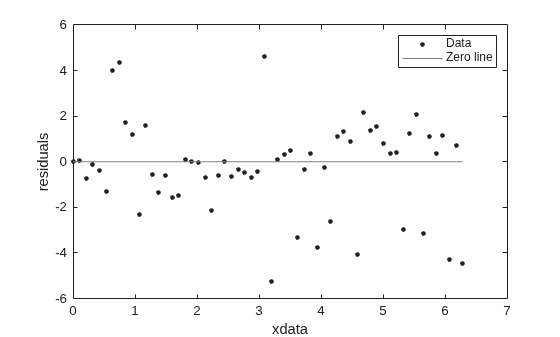
The plot shows that the residuals for fit1 have nonconstant variance across the values in xdata.
Load the census data set and fit a polynomial using the variables cdate and pop. These variables contain data for the year the census was taken, and the population size, respectively. Consider all dates before 1850 to be outliers.
load census
fitresult = fit(cdate,pop,"poly2",Exclude=cdate<1850)
fitresult =
     Linear model Poly2:
     fitresult(x) = p1*x^2 + p2*x + p3
     Coefficients (with 95% confidence bounds):
       p1 =    0.006709  (0.005497, 0.00792)
       p2 =      -24.15  (-28.81, -19.5)
       p3 =   2.175e+04  (1.728e+04, 2.621e+04)
Plot the cfit object fitresult with the default line styles.
plot(fitresult,cdate,pop,cdate<1850)
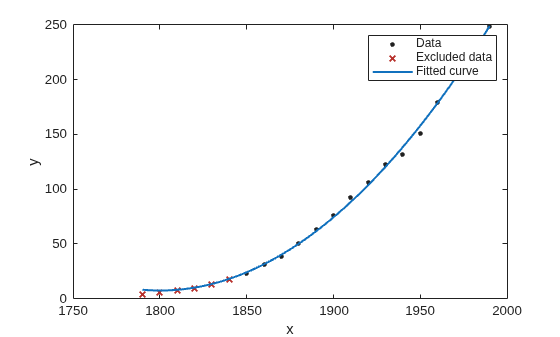
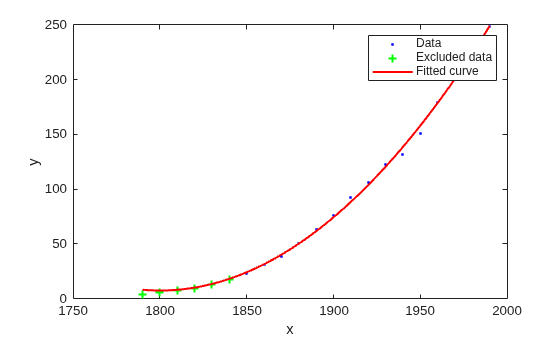
To modify the line styles, you can specify one or more of these arguments for the plot: DataLineSpec, FitLineSpec, and OutlierLineSpec. For this example, set the data line style as blue points, the fit line style as a solid red line, and the outlier line style as green plus signs.
plot(fitresult,"r-",cdate,pop,"b.",cdate<1850,"g+")
Input Arguments
Name-Value Arguments
Limitations
Bounds for the prediction function ("predfunc") and prediction
observations ("predobs") cannot be computed for fit objects with
constraint points specified. The software will plot NaN values for
the specified bounds.

