Get Started Reading TDMS File
R2026bThis example shows how to read data from a TDMS file into MATLAB® for analysis.
The TDMS file provided with this example contains sine wave measurement data for amplitude and phase. The measurements are in two channels, in the same channel group.
Inspect TDMS File Contents
Use the tdmsinfo function to obtain channel group and channel names in the TDMS file.
fileName = "SineWave.tdms";
info = tdmsinfo(fileName);
info.ChannelList
ans = 2×8 table
1 "Measured Data" "" "Amplitude sweep" "" "" "Double" 3500
1 "Measured Data" "" "Phase sweep" "" "" "Double" 3500
Read Data Properties from TDMS File
Use the tdmsreadprop function to view data properties from the file.
tdmsreadprop(fileName)
ans = 1×7 table
    "SineWave"    ""    2022-01-13 10:03:31.000000000    "Admin"    "Amplitude And Phase Sweep"    "01/13/2022"    "10:03:31"
Specify a ChannelGroupName and ChannelName arguments to view properties of a specific channel.
group = "Measured Data";
channel = "Amplitude sweep";
tdmsreadprop(fileName, ChannelGroupName=group, ChannelName=channel)
ans = 1×19 table
    "Amplitude sweep"    ""    ""    "DT_DOUBLE"    "Numeric"    "not calculated"    "Sine"    1    2022-01-13 08:38:35.674852848    2022-01-13 08:38:35.674852848    "t"    "not calculated"    1.0000e-03    3500    0    1904-01-01 05:21:10.000000000    "relative"    "Time"    "s"
Read Timetable Data from TDMS File into MATLAB
To read data into a timetable, derive the start time and time step, typically contained in the channel properties.
timeStep = tdmsreadprop(fileName, ChannelGroupName=group, ChannelName=channel, PropertyNames="wf_increment")timeStep = table
0.001
startTime = tdmsreadprop(fileName, ChannelGroupName=group, ChannelName=channel, PropertyNames="wf_start_time")startTime = table
1904-01-01 05:21:10.000000000
Using the start time and time step as arguments to the tdmsread function, read the data into MATLAB as a cell array of timetables. View some of the data from first channel group.
data = tdmsread(fileName, StartTime=startTime.wf_start_time, TimeStep=seconds(timeStep.wf_increment));
ttData = data{1};
head(ttData)
Time Amplitude sweep Phase sweep
_____________________________ _______________ ___________
1904-01-01 05:21:10.000000000 0 0
1904-01-01 05:21:10.001000000 0 0.063418
1904-01-01 05:21:10.002000000 0 0.12658
1904-01-01 05:21:10.003000000 0 0.18923
1904-01-01 05:21:10.004000000 0 0.25112
1904-01-01 05:21:10.005000000 0 0.312
1904-01-01 05:21:10.006000000 0 0.37163
1904-01-01 05:21:10.007000000 0 0.42975
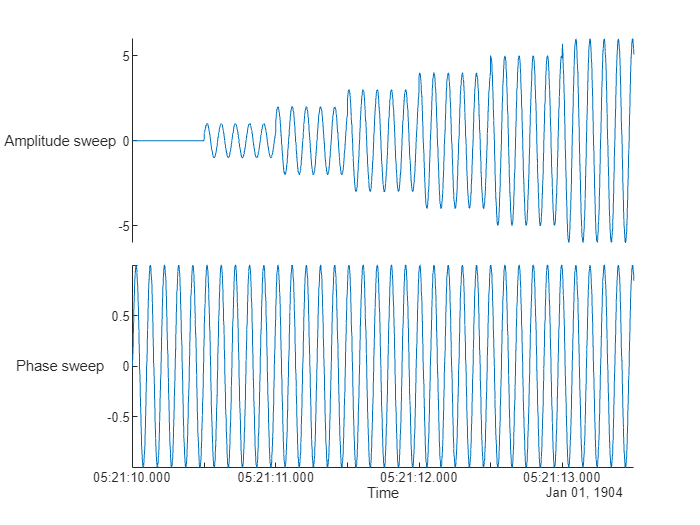
Use a stacked plot to visualize the relationship between the data of different channels.
stackedplot(ttData);