coverageAreaPlotter
Coverage area plotter for bird's-eye plot
Description
caPlotter = coverageAreaPlotter(bep)CoverageAreaPlotter object that configures the display of
sensor coverage areas on a bird's-eye plot. The CoverageAreaPlotter
object is stored in the Plotters property of the input birdsEyePlot object, bep. To display the sensor coverage
areas, use the plotCoverageArea function.
caPlotter = coverageAreaPlotter(bep,Name,Value)Name,Value pair arguments. For
example, coverageAreaPlotter(bep,'DisplayName','Coverage area') sets
the display name that appears in the bird's-eye-plot legend.
Examples
Create a bird's-eye plot with an x-axis range from 0 to 90 meters and a y-axis range from –35 to 35 meters. Create a coverage area plotter that displays coverage areas in red.
bep = birdsEyePlot('XLim',[0 90],'YLim',[-35 35]);
caPlotter = coverageAreaPlotter(bep,'DisplayName','Radar coverage area','FaceColor','r');
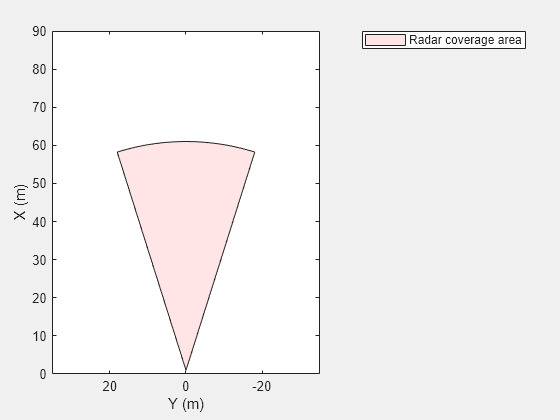
Display a coverage area that has a 35-degree field of view and a 60-meter range. Mount the coverage area sensor 1 meter in front of the origin. Set the orientation angle of the sensor to 0 degrees.
mountPosition = [1 0];
range = 60;
orientation = 0;
fieldOfView = 35;
plotCoverageArea(caPlotter,mountPosition,range,orientation,fieldOfView);
Input Arguments
Name-Value Arguments
Specify optional pairs of arguments as
Name1=Value1,...,NameN=ValueN, where Name is
the argument name and Value is the corresponding value.
Name-value arguments must appear after other arguments, but the order of the
pairs does not matter.
Before R2021a, use commas to separate each name and value, and enclose
Name in quotes.
Example: coverageAreaPlotter('FaceColor','red') sets the fill color of
sensor coverage areas to red.
Plotter name to display in legend, specified as the comma-separated pair consisting of
'DisplayName' and character vector or string scalar. If you do
not specify a name, the bird's-eye plot does not display a legend entry for the
plotter.
Fill color of coverage areas, specified as the comma-separated pair consisting of
'FaceColor' and an RGB triplet, a hexadecimal color code, a color
name, or a short color name.
For a custom color, specify an RGB triplet or a hexadecimal color code.
An RGB triplet is a three-element row vector whose elements specify the intensities of the red, green, and blue components of the color. The intensities must be in the range
[0,1], for example,[0.4 0.6 0.7].A hexadecimal color code is a string scalar or character vector that starts with a hash symbol (
#) followed by three or six hexadecimal digits, which can range from0toF. The values are not case sensitive. Therefore, the color codes"#FF8800","#ff8800","#F80", and"#f80"are equivalent.
Alternatively, you can specify some common colors by name. This table lists the named color options, the equivalent RGB triplets, and the hexadecimal color codes.
| Color Name | Short Name | RGB Triplet | Hexadecimal Color Code | Appearance |
|---|---|---|---|---|
"red" | "r" | [1 0 0] | "#FF0000" |
|
"green" | "g" | [0 1 0] | "#00FF00" |
|
"blue" | "b" | [0 0 1] | "#0000FF" |
|
"cyan"
| "c" | [0 1 1] | "#00FFFF" |
|
"magenta" | "m" | [1 0 1] | "#FF00FF" |
|
"yellow" | "y" | [1 1 0] | "#FFFF00" |
|
"black" | "k" | [0 0 0] | "#000000" |
|
"white" | "w" | [1 1 1] | "#FFFFFF" |
|
"none" | Not applicable | Not applicable | Not applicable | No color |
This table lists the default color palettes for plots in the light and dark themes.
| Palette | Palette Colors |
|---|---|
Before R2025a: Most plots use these colors by default. |
|
|
|
You can get the RGB triplets and hexadecimal color codes for these palettes using the orderedcolors and rgb2hex functions. For example, get the RGB triplets for the "gem" palette and convert them to hexadecimal color codes.
RGB = orderedcolors("gem");
H = rgb2hex(RGB);
Before R2023b: Get the RGB triplets using RGB =
get(groot,"FactoryAxesColorOrder").
Before R2024a: Get the hexadecimal color codes using H =
compose("#%02X%02X%02X",round(RGB*255)).
Border color of coverage areas, specified as the comma-separated pair consisting
of 'EdgeColor' and an RGB triplet, a hexadecimal color code, a
color name, or a short color name.
For a custom color, specify an RGB triplet or a hexadecimal color code.
An RGB triplet is a three-element row vector whose elements specify the intensities of the red, green, and blue components of the color. The intensities must be in the range
[0,1], for example,[0.4 0.6 0.7].A hexadecimal color code is a string scalar or character vector that starts with a hash symbol (
#) followed by three or six hexadecimal digits, which can range from0toF. The values are not case sensitive. Therefore, the color codes"#FF8800","#ff8800","#F80", and"#f80"are equivalent.
Alternatively, you can specify some common colors by name. This table lists the named color options, the equivalent RGB triplets, and the hexadecimal color codes.
| Color Name | Short Name | RGB Triplet | Hexadecimal Color Code | Appearance |
|---|---|---|---|---|
"red" | "r" | [1 0 0] | "#FF0000" |
|
"green" | "g" | [0 1 0] | "#00FF00" |
|
"blue" | "b" | [0 0 1] | "#0000FF" |
|
"cyan"
| "c" | [0 1 1] | "#00FFFF" |
|
"magenta" | "m" | [1 0 1] | "#FF00FF" |
|
"yellow" | "y" | [1 1 0] | "#FFFF00" |
|
"black" | "k" | [0 0 0] | "#000000" |
|
"white" | "w" | [1 1 1] | "#FFFFFF" |
|
"none" | Not applicable | Not applicable | Not applicable | No color |
This table lists the default color palettes for plots in the light and dark themes.
| Palette | Palette Colors |
|---|---|
Before R2025a: Most plots use these colors by default. |
|
|
|
You can get the RGB triplets and hexadecimal color codes for these palettes using the orderedcolors and rgb2hex functions. For example, get the RGB triplets for the "gem" palette and convert them to hexadecimal color codes.
RGB = orderedcolors("gem");
H = rgb2hex(RGB);
Before R2023b: Get the RGB triplets using RGB =
get(groot,"FactoryAxesColorOrder").
Before R2024a: Get the hexadecimal color codes using H =
compose("#%02X%02X%02X",round(RGB*255)).
Transparency of coverage areas, specified as the comma-separated pair consisting
of 'FaceAlpha' and a scalar in the range [0, 1]. A value of
0 makes the coverage area fully transparent. A value of
1 makes the coverage area fully opaque.
Tag associated with the plotter object, specified as the comma-separated pair
consisting of 'Tag' and a character vector or string scalar. The
default value is 'Plotter, where
N'N is an integer that corresponds to the
Nth plotter associated with the input birdsEyePlot object.
Output Arguments
Version History
Introduced in R2017a