crosscorr
Sample cross-correlation
Syntax
Description
[
returns the sample cross-correlation
function (XCF) and associated lags between two input vectors of
univariate time series data.xcf,lags] = crosscorr(y1,y2)
XCFTbl = crosscorr(Tbl)DataVariables name-value argument. (since R2022a)
[___, uses any input-argument combination in the
previous syntaxes, and returns the output-argument combination for the
corresponding input arguments and the approximate upper and lower confidence
bounds on the XCF.bounds]
= crosscorr(___)
[___] = crosscorr(___,
uses additional options specified by one or more name-value arguments. For
example, Name=Value)crosscorr(Tbl,DataVariables=["RGDP"
"CPI"],NumLags=10,NumSTD=1.96) returns the sample XCF for lags -10
through 10 of the table variables "RGDP" and
"CPI" in Tbl and 95% confidence
bounds.
crosscorr(___) plots the sample XCF between
the input series with confidence bounds.
crosscorr(
plots on the axes specified by ax,___)ax instead of
the current axes (gca). ax can precede any of the input
argument combinations in the previous syntaxes.
[___, plots the sample XCF between the input
series and additionally returns handles to plotted graphics objects. Use
elements of h]
= crosscorr(___)h to modify properties of the plot after you
create it.
Examples
Compute the XCF between two univariate time series. Input the time series data as numeric vectors.
Load the equity index data Data_EquityIdx.mat. The variable Data is a 3028-by-2 matrix of daily closing prices from the NASDAQ and NYSE composite indices. Plot the two series.
load Data_EquityIdx

yyaxis left
dt = datetime(dates,ConvertFrom="datenum");
plot(dt,Data(:,1))
ylabel("NASDAQ")
yyaxis right
plot(dt,Data(:,2))
ylabel("NYSE")
title("Daily Closing Prices, 1990-2001")
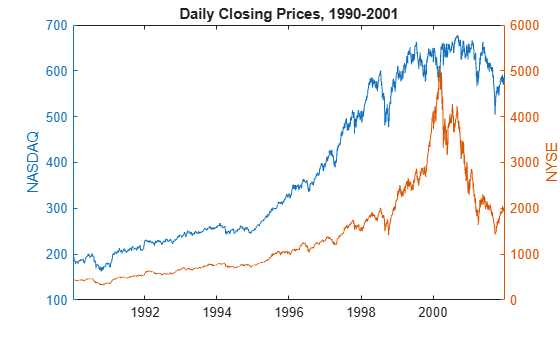
The series exhibit exponential growth.
Compute the returns of each series.
Ret = price2ret(Data);
Ret is a 3027-by-2 series of returns; it has one less observation than Data.
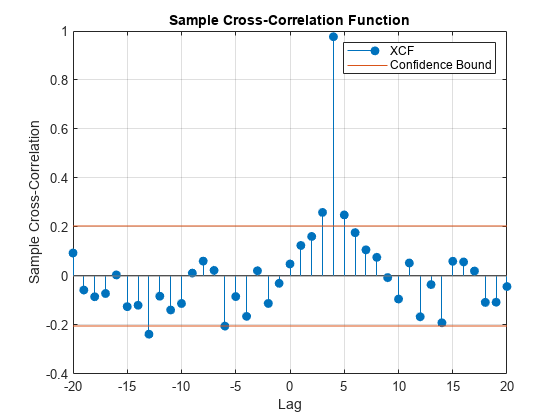
Compute the XCF between the NASDAQ and NYSE returns, and return the associated lags.
rnasdaq = Ret(:,1);
rnyse = Ret(:,2);
[xcf,lags] = crosscorr(rnasdaq,rnyse);
xcf and lags are 41-by-1 vectors that describe the XCF.
Display several values of the XCF.
XCF = [xcf lags];
XCF([1:3 20:22 end-2:end],:)
ans = 9×2

   -0.0108  -20.0000
    0.0186  -19.0000
   -0.0002  -18.0000
    0.0345   -1.0000
    0.7080         0
    0.0651    1.0000
   -0.0461   18.0000
    0.0010   19.0000
    0.0015   20.0000
The correlation between the current NASDAQ return and the NYSE return from 20 days before is xcf(1) = -0.0108. The correlation between the NASDAQ and NYSE returns is xcf(21) = 0.7080. The correlation between the NASDAQ return from 20 days ago and the current NYSE return is xcf(41) = 0.0015.
Since R2022a
Compute the XCF between two univariate time series, which are two variables in a table.
Load the equity index data Data_EquityIdx.mat. The variable DataTable is a 3028-by-2 table of daily closing prices from the NYSE and NASDAQ composite indices, which are stored in the variables NYSE and NASDAQ.
load Data_EquityIdx
DataTable.Properties.VariableNames
ans = 1×2 cell
{'NYSE'} {'NASDAQ'}
Compute the returns of the series. Store the results in a new table.
RetTbl = price2ret(DataTable);
head(RetTbl)
    Tick    Interval       NYSE         NASDAQ
    ____    ________    __________    __________

     2         1        -0.0010106     0.0034122
     3         1        -0.0076633    -0.0032816
     4         1        -0.0084415    -0.0025501
     5         1         0.0035387     0.0010688
     6         1         -0.010188    -0.0042382
     7         1        -0.0063818     -0.013378
     8         1         0.0034295    -0.0040909
     9         1         -0.023407     -0.020573
RetTbl is a 3027-by-4 table containing the returns of the indices, ticks (days by default), and time intervals between successive prices.
Compute the XCF between the NASDAQ and NYSE return series.
XCFTbl = crosscorr(RetTbl)
XCFTbl=41×2 table
    Lags        XCF
    ____    ___________

    -20       -0.010809
    -19        0.018571
    -18     -0.00016185
    -17       -0.020271
    -16       -0.029353
    -15      0.00023188
    -14      -0.0080616
    -13        0.041498
    -12        0.078821
    -11       -0.013793
    -10       0.0076655
     -9         0.01763
     -8      -0.0011033
     -7       -0.011457
     -6       -0.016523
     -5       -0.046749
      ⋮
crosscorr returns the results in the table XCFTbl, where variables correspond to the XCF (XCF) and associated lags (Lags).
By default, crosscorr computes the XCF of the two variables in the table. To select variables from an input table, set the DataVariables option.
Since R2022a
Consider the equity index series in Compute XCF of Table Variable.
Load the NYSE and NASDAQ closing price series in Data_EquityIdx.mat and preprocess the series. Compute the XCF and return the XCF confidence bounds.
load Data_EquityIdx
RetTbl = price2ret(DataTable);
[XCFTbl,bounds] = crosscorr(RetTbl)XCFTbl=41×2 table
Lags XCF
____ ___________
-20 -0.010809
-19 0.018571
-18 -0.00016185
-17 -0.020271
-16 -0.029353
-15 0.00023188
-14 -0.0080616
-13 0.041498
-12 0.078821
-11 -0.013793
-10 0.0076655
-9 0.01763
-8 -0.0011033
-7 -0.011457
-6 -0.016523
-5 -0.046749
⋮
bounds = 2×1

    0.0364
   -0.0364
Assuming the NYSE and NASDAQ return series are uncorrelated, an approximate 95.4% confidence interval on the XCF is (-0.0364, 0.0364).
Generate 100 random variates from a Gaussian distribution with mean 0 and variance 1.
rng(3); % For reproducibility
x = randn(100,1);
Create a 4-period delayed version of x.
y = lagmatrix(x,4);
Plot the XCF between x and y. Because lagmatrix prepends lagged series with NaN values and crosscorr does not support NaN values, start the series at observation 5.
crosscorr(x(5:end),y(5:end))
The upper and lower confidence bounds are the horizontal lines in the XCF plot. By design, the XCF peaks at lag 4.
Since R2022a
Load the currency exchange rates data set Data_FXRates.mat. The table DataTable contains daily exchange rates of several countries, relative to the US dollar from 1980 through 1998 (with omissions).
load Data_FXRates.mat
dt = datetime(dates,ConvertFrom="datenum");
Plot the UK pound and French franc exchange rates.
yyaxis left
plot(dt,DataTable.GBP)
ylabel("UK Pound/$")
yyaxis right
plot(dt,DataTable.FRF)
ylabel("French Franc/$")
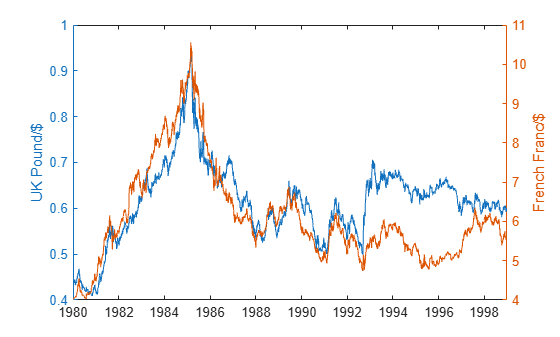
The series appear to be correlated.
Stabilize all series in the table by computing the first difference.
DiffDT = varfun(@diff,DataTable);
DiffDT.Properties.VariableNames = DataTable.Properties.VariableNames;
Determine whether lags of one series are associated with the other series by computing the XCF between the daily changes in the UK pound and French franc exchange rates.
figure
crosscorr(DiffDT,DataVariables=["GBP" "FRF"]);
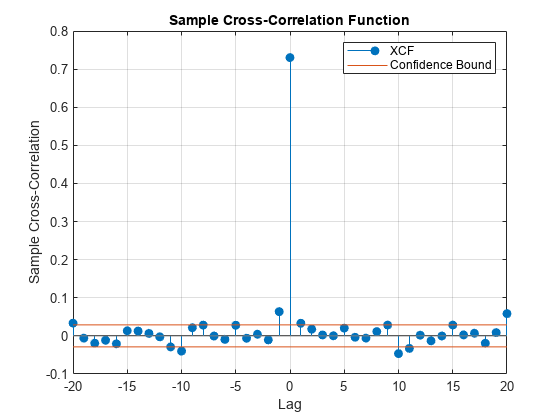
The series have a high contemporaneous correlation, but all other cross-correlations are either insignificant or below 0.1.
Specify the AR(1) model for the first series
where is Gaussian with mean 0 and variance 1.
MdlY1 = arima(AR=0.3,Constant=2,Variance=1);
MdlY1 is a fully specified arima object representing the AR(1) model.
Simulate data from the AR(1) model.
rng(3); % For reproducibility
T = 1000;
y1 = simulate(MdlY1,T);
Simulate standard Gaussian variates for the second series; induce correlation at lag 36.
y2 = [randn(36,1); y1(1:end-36) + randn(T-36,1)*0.1];
Plot the XCF by using the default settings.
crosscorr(y1,y2)
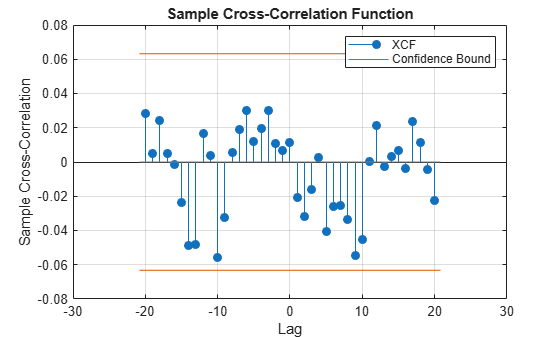
All correlations in the plot are within the 2-standard-error confidence bounds. Therefore, none are significant.
Plot the XCF for 60 lags on both sides of lag 0. Specify 3 standard errors for the confidence bounds.
crosscorr(y1,y2,NumLags=60,NumSTD=3)
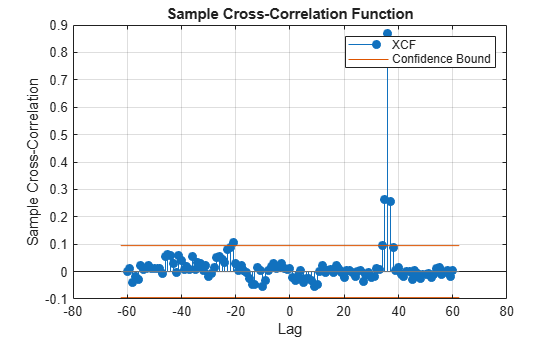
The plot shows significant correlations at and around lag 36.
Input Arguments
Name-Value Arguments
Output Arguments
More About
Algorithms
If
y1andy2have different lengths,crosscorrappends enough zeros to the end of the shorter vector to make both vectors the same size.crosscorruses a Fourier transform (fft) to compute the XCF in the frequency domain, and thencrosscorrconverts back to the time domain using an inverse Fourier transform (ifft).NaNvalues in the input series result inNaNvalues in the output XCF. Unlikeautocorrandparcorr,crosscorrdoes not treatNaNvalues as missing completely at random. Whereasautocorrandparcorrcompute coefficients in the time domain,crosscorrusesfftandifftto compute coefficients in the frequency domain. Therefore, missing data treatments followfftandifftdefaults.crosscorrplots the XCF when you do not request any output or when you request the fourth output.
References
[1] Box, George E. P., Gwilym M. Jenkins, and Gregory C. Reinsel. Time Series Analysis: Forecasting and Control. 3rd ed. Englewood Cliffs, NJ: Prentice Hall, 1994.