ttplot
Description
ttplot plots transition functions of threshold
transitions. To evaluate the transition function for observations of the threshold variable,
use ttdata.
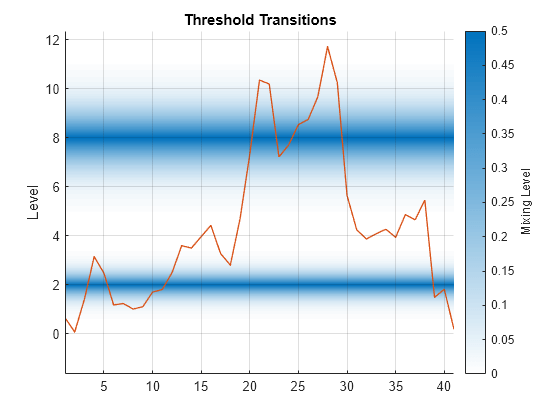
ttplot( plots transition bands between
states of the threshold transitions tt)tt on the
y-axis. The plot shows gradient shading of the mixing level in the transition
bands.
ttplot(
uses additional options specified by one or more name-value arguments. For example,
tt,Name,Value)ttplot(tt,Type="graph") specifies plotting a line plot of the
transition function at each threshold level on the same axes.
ttplot(
plots on the axes specified by ax,___)ax instead of the current axes (gca) using any of the input argument combinations in the previous syntaxes.
h = ttplot(___)h to the threshold transitions plot. Use h to modify properties of the plot after
you create it.
Examples
Input Arguments
Name-Value Arguments
Output Arguments
More About
Tips
Use the
Widthname-value argument to adjust the display of transition function graph (Type="graph") plots with varying rates. In multilevel gradient plots (Type="gradient"), a large enough width results in overlapping transition bands that can misrepresent data. By default,ttplotchooses an appropriate width for displaying all transitions.
Version History
Introduced in R2021b


