currentTruthMetrics
Metrics for recent truths
Description
metricsTable = currentTruthMetrics(errorMetrics)metricsTable, for every truth identifier
provided in the most recent update.
Examples
Examine the assignments and errors for a system tracking two targets.
First, load the stored track data.
load trackmetricex tracklog truthlog
Create objects to analyze assignment and error metrics.
tam = trackAssignmentMetrics;
tem = trackErrorMetrics;
Create the output variables.
posRMSE = zeros(numel(tracklog),1);
velRMSE = zeros(numel(tracklog),1);
posANEES = zeros(numel(tracklog),1);
velANEES = zeros(numel(tracklog),1);
Loop over all tracks to:
Extract the tracks and ground truth at the i th tracker update.
Analyze and retrieve the current track-to-truth assignment.
Analyze instantaneous error metrics over all tracks and truths.
for i=1:numel(tracklog)
    tracks = tracklog{i};
    truths = truthlog{i};
    [trackAM,truthAM] = tam(tracks, truths);
    [trackIDs,truthIDs] = currentAssignment(tam);
    [posRMSE(i),velRMSE(i),posANEES(i),velANEES(i)] = ...
        tem(tracks,trackIDs,truths,truthIDs);
end
Show the track metrics table.
trackMetricsTable(tam)
ans=4×16 table
    TrackID    AssignedTruthID    Surviving    TotalLength    UnreportedStatus    DeletionStatus    DeletionLength    DivergenceStatus    DivergenceCount    DivergenceLength    RedundancyStatus    RedundancyCount    RedundancyLength    FalseTrackStatus    FalseTrackLength    SwapCount
    _______    _______________    _________    ___________    ________________    ______________    ______________    ________________    _______________    ________________    ________________    _______________    ________________    ________________    ________________    _________

       1             NaN            false         1120             false              false               0                false                 3                   3                false                 0                   0                false                  0               0
       2             NaN            false         1736             false              false               0                false                 8                  88                false                 0                   0                false                 28               3
       6               3            true          1138             false              false               0                false                 4                 314                false                 1                  28                false                  0               2
       8               2            true           662             false              false               0                false                 2                  29                false                 1                 169                false                 28               0
Show the truth metrics table.
truthMetricsTable(tam)
ans=2×11 table
    TruthID    AssociatedTrackID    DeletionStatus    TotalLength    UnreportedStatus    BreakStatus    BreakCount    BreakLength    InCoverageArea    EstablishmentStatus    EstablishmentLength
    _______    _________________    ______________    ___________    ________________    ___________    __________    ___________    ______________    ___________________    ___________________

       2               8                false            2678             false             false           4             168            true                 true                    56
       3               6                false            2678             false             false           3             645            true                 true                    84
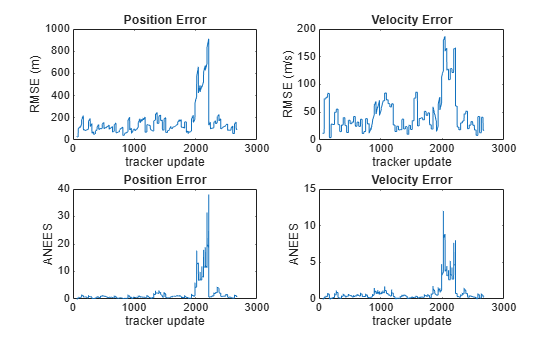
Plot the RMSE and ANEES error metrics.
subplot(2,2,1)
plot(posRMSE)
title('Position Error')
xlabel('tracker update')
ylabel('RMSE (m)')

subplot(2,2,2)
plot(velRMSE)
title('Velocity Error')
xlabel('tracker update')
ylabel('RMSE (m/s)')

subplot(2,2,3)
plot(posANEES)
title('Position Error')
xlabel('tracker update')
ylabel('ANEES')

subplot(2,2,4)
plot(velANEES)
title('Velocity Error')
xlabel('tracker update')
ylabel('ANEES')
Show the current error metrics for each individual recorded track.
currentTrackMetrics(tem)
ans=2×5 table
    TrackID    posRMS    velRMS    posANEES    velANEES
    _______    ______    ______    ________    ________

       6       44.712    20.988    0.05974     0.31325
       8       129.26    12.739     1.6745      0.2453
Show the current error metrics for each individual recorded truth object.
currentTruthMetrics(tem)
ans=2×5 table
    TruthID    posRMS    velRMS    posANEES    velANEES
    _______    ______    ______    ________    ________

       2       129.26    12.739     1.6745      0.2453
       3       44.712    20.988    0.05974     0.31325
Show the cumulative error metrics for each individual recorded track.
cumulativeTrackMetrics(tem)
ans=4×5 table
    TrackID    posRMS    velRMS    posANEES    velANEES
    _______    ______    ______    ________    ________

       1       117.69    43.951    0.58338     0.44127
       2        129.7      42.8    0.81094     0.42509
       6       371.35    87.083     4.5208      1.6952
       8       130.45    53.914     1.0448     0.44813
Show the cumulative error metrics for each individual recorded truth object.
cumulativeTruthMetrics(tem)
ans=2×5 table
    TruthID    posRMS    velRMS    posANEES    velANEES
    _______    ______    ______    ________    ________

       2       258.21    65.078     2.2514     0.93359
       3       134.41    48.253    0.96314     0.49183
Input Arguments
Output Arguments
Version History
Introduced in R2018b