CursorMeasurementsConfiguration
Measure signal values using vertical waveform cursors that track along the signal
Since R2022a
Description
Use the CursorMeasurementsConfiguration object to enable waveform
cursors. You can control the cursor settings from the toolstrip of the scope or from the
command line.
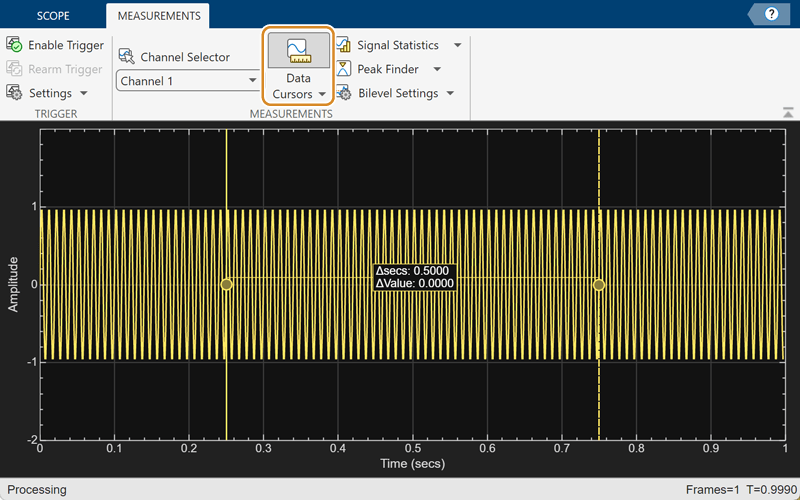
To display vertical cursors on each signal and to modify the cursor settings in the scope UI, click the Measurements tab and enable Data Cursors. Each cursor tracks a vertical line along the signal. The scope displays the difference between x- and y-values of the signal at the two cursors in the box between the cursors. The cursors appear only when the scope has at least one signal in its display. You can use the mouse to move the vertical cursors left and right.
Time Scope Toolstrip
Creation
Description
cursormeas = CursorMeasurementsConfiguration() creates a cursor
measurements configuration object.
Properties
Examples
Create a sine wave and view it in the Time Scope. Enable data cursors programmatically.
The timescope object requires one of these products:
DSP System Toolbox™
Navigation Toolbox™
Sensor Fusion and Tracking Toolbox™
Initialization
Create the input sine wave using the sin function. Create a timescope MATLAB® object to display the signal. Set the TimeSpan property to 1 second.
f = 100;
fs = 1000;
swv = sin(2.*pi.*f.*(0:1/fs:1-1/fs)).';
scope = timescope(SampleRate=fs,...
    TimeSpanSource="property",...
    TimeSpan=1);
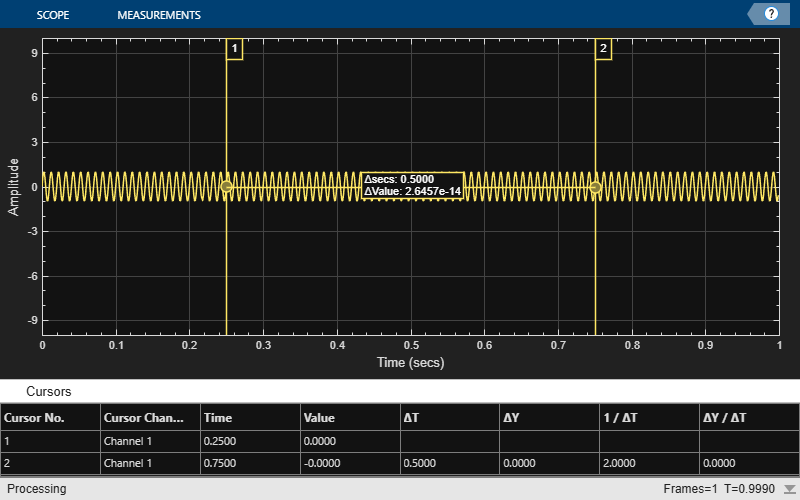
Enable Data Cursors
Enable data cursors in the scope programmatically by setting the Enabled property of the CursorMeasurementsConfiguration object to true.
scope.CursorMeasurements.Enabled = true;
scope(swv);
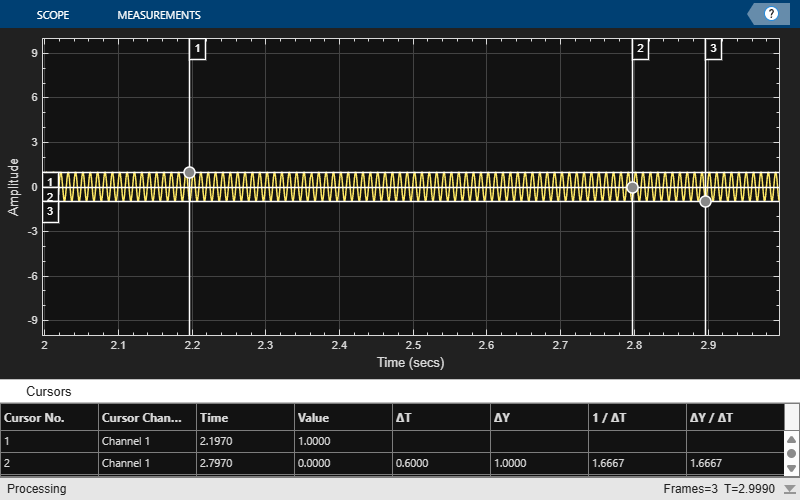
Specify Multiple Data Cursors
Specify XLocation to [0.2 0.8 0.9]. The scope shows waveform cursors at these locations.
scope.CursorMeasurements.XLocation = [0.2 0.8 0.9]
scope =
  timescope handle with properties:

               SampleRate: 1000
           TimeSpanSource: 'property'
                 TimeSpan: 1
    TimeSpanOverrunAction: 'scroll'
              AxesScaling: 'onceatstop'

  Show all properties
scope(swv)
If you specify LinkToWaveform as false, the scope shows screen cursors based on the XLocation and YLocation values you specify.
scope.CursorMeasurements.LinkToWaveform = false;
scope.CursorMeasurements.YLocation = [1 0 -1];
scope(swv)