plotDetection
Plot set of detections in theater detection plotter
Syntax
Description
plotDetection(
specifies positions of M detected objects whose positions are plotted by
the detection plotter detPlotter,positions)detPlotter. Specify the positions as an
M-by-3 matrix, where each column of the matrix corresponds to the
x-, y-, and z-coordinates of the
detected object locations.
plotDetection(
also specifies the corresponding velocities of the detections. Velocities are plotted as
line vectors emanating from the center positions of the detections. If specified,
detPlotter,positions,velocities)velocities must have the same dimensions as
positions.
plotDetection(
also specifies a cell vector of length M whose elements contain the text
labels corresponding to the M detections specified in the positions
matrix. If omitted, no labels are plotted.detPlotter,positions,___,labels)
plotDetection(
also specifies the covariances of the M detection uncertainties, where
the covariances are a 3-by-3-by-M matrix of covariances that are centered
at the positions of each detection. The uncertainties are plotted as an ellipsoiddetPlotter,positions,___,covariances)
Examples
Create a theater plot.
tp = theaterPlot('XLim',[0,90],'YLim',[-35,35],'ZLim',[1,10]);
Create a detection plotter with the name Radar Detections.
radarPlotter = detectionPlotter(tp,'DisplayName','Radar Detections');
Update the detection plotter with three detections labeled 'R1', 'R2', and 'R3' positioned in units of meters at , , and with corresponding velocities (in m/s) of , , and , respectively.
positions = [30, 5, 4; 30, -10, 2; 30, 15, 1];
velocities = [-10, 0, 2; -10, 3, 1; -10, -4, 1];
labels = {'R1','R2','R3'};
plotDetection(radarPlotter, positions, velocities, labels)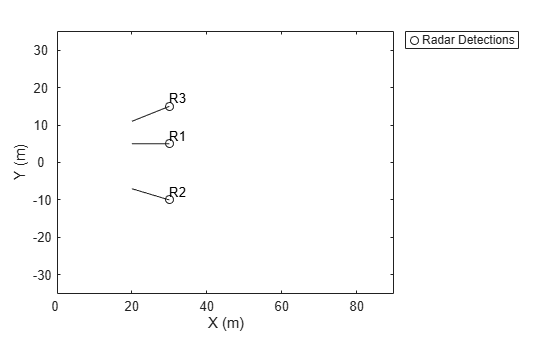
Input Arguments
Version History
Introduced in R2018b
See Also
theaterPlot | detectionPlotter | clearData | clearPlotterData