freqz2
R2026b2-D frequency response
Syntax
Description
[
returns the 64-by-64 frequency response H,fx,fy] = freqz2(h)H of the 2-D FIR filter
h. h must be in the form of a
correlation kernel. freqz2 also returns the frequency vectors
fx and fy as normalized frequencies in
the range -1.0 to 1.0, where 1.0 corresponds to half the sampling frequency, or π
radians.
freqz2(___) displays a mesh plot of the 2-D
magnitude frequency response when no output arguments are specified.
Examples
This example shows how to create a two-dimensional filter using fwind1 and how to view the filter's frequency response using freqz2.
Create an ideal frequency response.
Hd = zeros(16,16);
Hd(5:12,5:12) = 1;
Hd(7:10,7:10) = 0;
Create a 1-D window. This example uses a Bartlett window of length 16.
w = [0:2:16 16:-2:0]/16;
Create the 16-by-16 filter using fwind1 and the 1-D window. This filter gives the closest match to the ideal frequency response.
h = fwind1(Hd,w);
Display the actual frequency response of the filter.
colormap(parula(64))
freqz2(h,[32 32]);
axis ([-1 1 -1 1 0 1])
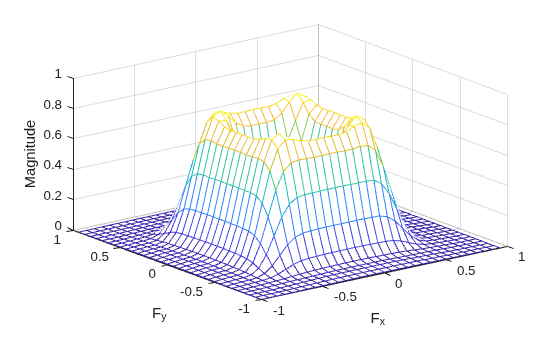
This example shows how to design a 2-D FIR filter using the frequency sampling method on a desired frequency response.
Given a matrix that defines the shape of the frequency response, the frequency sampling method creates a filter in the spatial domain whose frequency response matches the matrix at the sampled frequencies. Frequency sampling places no constraints on the behavior of the frequency response of the filter between the sampled frequencies. Further, frequency sampling might not be able to capture discontinuities in the ideal frequency response. These interpolation errors and discontinuities usually cause ripples in the frequency response of the filter. Ripples are oscillations around a constant value. The frequency response of a practical filter often has ripples, whereas the frequency response of an ideal filter is flat.
Define and visualize the target 2-D frequency response of an 11-by-11 filter.
Hd = zeros(11,11);
Hd(4:8,4:8) = 1;
[f1,f2] = freqspace(11,"meshgrid");
mesh(f1,f2,Hd)
title("Desired Frequency Response")
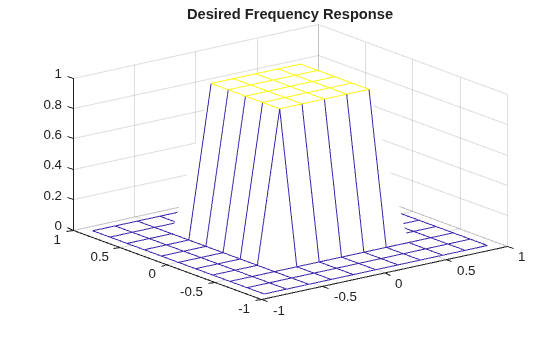
Create the filter based on the target frequency response using the fsamp2 function. The fsamp2 function returns the filter h in the spatial domain with a frequency response that passes through the points in the input matrix Hd.
h = fsamp2(Hd);
Plot the frequency response of the filter.
freqz2(h,[32 32])
title("Actual Frequency Response")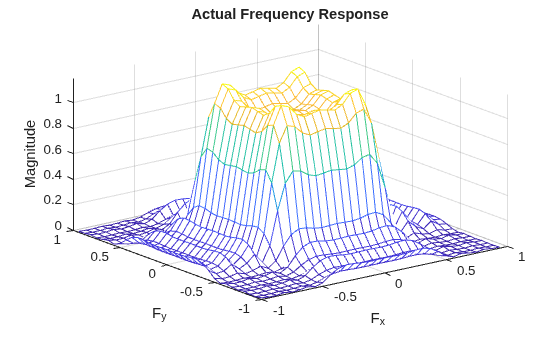
Notice the ripples in the actual frequency response compared to the desired frequency response. These ripples are a fundamental problem with the frequency sampling design method that occur wherever there are sharp transitions in the desired response. You can reduce the spatial extent of the ripples by using a larger filter. However, a larger filter does not reduce the height of the ripples, and requires more computation time for filtering. To achieve a smoother approximation of the desired frequency response, consider using the frequency transformation method or the windowing method, instead.
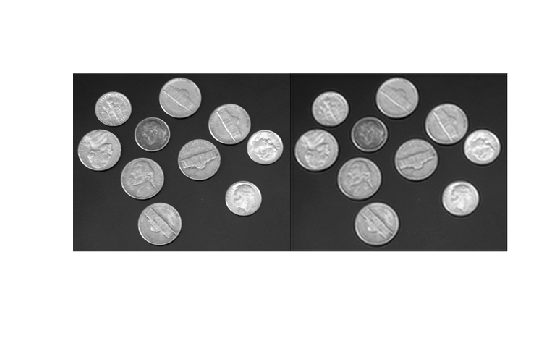
Filter an image using the designed filter, and visualize the results.
inputImage = imread("coins.png");
outputImage = imfilter(inputImage,h);
imshowpair(inputImage,outputImage,"montage")
Input Arguments
Output Arguments
Version History
Introduced before R2006a

