beginDrawingFromPoint
Begin drawing ROI from specified point
Syntax
Description
Examples
Create a new script called sampleDrawLine.m. Inside the script,
copy and paste this code, then save the file.
hIm = imshow(imread('coins.png'));
hIm.ButtonDownFcn = @(~,~) buttonPressedCallback(hIm.Parent);

function buttonPressedCallback(hAx)
    cp = hAx.CurrentPoint;
    cp = [cp(1,1) cp(1,2)];
    obj = images.roi.Line('Parent',hAx,'Color',rand([1,3]));
    beginDrawingFromPoint(obj,cp);
end
Return to the MATLAB® command window. Run the script by entering the command:
sampleDrawLine
The code opens a figure window containing an image of coins. Each time you click the
mouse over the figure, the script executes the callback function,
buttonPressedCallback. The callback function begins drawing a new
ROI starting from the pixel you clicked.
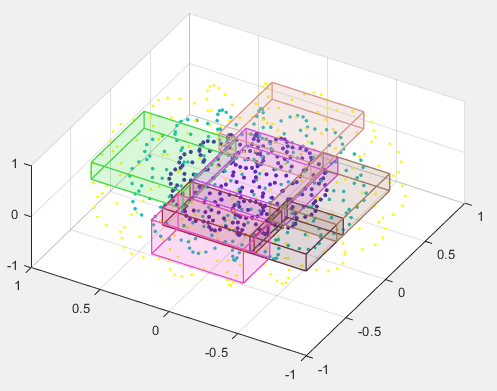
In the editor, open a file called cuboidExample.m. Copy and paste
this code into the file and then save it.
function cuboidExample
    [x,y,z] = sphere(16);
    X = [x(:)*.5 x(:)*.75 x(:)];
    Y = [y(:)*.5 y(:)*.75 y(:)];
    Z = [z(:)*.5 z(:)*.75 z(:)];

    % Specify the size and color of each marker.
    S = repmat([1 .75 .5]*10,numel(x),1);
    C = repmat([1 2 3],numel(x),1);

    % Create a 3-D scatter plot
    figure
    hScatter = scatter3(X(:),Y(:),Z(:),S(:),C(:),'filled');
    view(-60,60);

    % Begin drawing cuboids when a scatter
    % point is clicked
    hScatter.ButtonDownFcn = @(~,~) buttonPressedCallback(hScatter.Parent);

    function buttonPressedCallback(hAx)
       cp = hAx.CurrentPoint;
       cp = cp(1,1:3);
       obj = images.roi.Cuboid('Parent',hAx,'Color',rand([1,3]));
       obj.beginDrawingFromPoint(cp);
    end
 end
Return to the MATLAB command window and run the function by entering the command:
cuboidExample
The code opens a figure window containing a scatter plot. Each time you click the
mouse over the scatter plot, the function executes the callback function,
buttonPressedCallback, and draws a new cuboidal ROI at the pixel
you clicked.
Input Arguments
Version History
Introduced in R2018b
See Also
draw | drawassisted | drawcircle | drawcuboid | drawellipse | drawfreehand | drawline | drawpoint | drawpolygon | drawpolyline | drawrectangle