draw
Begin drawing ROI interactively
Description
draw( enters interactive mode to draw the
shape for object ROI)ROI in the current axes
(gca).
Examples
Read an image into the workspace and display it.
I = imread("wagon.jpg");
figure
imshow(I);
Draw a triangular ROI on the image interactively. To improve the visibility of the ROI edge, specify a thick line width and bright cyan color of the ROI edge.
p = drawpolygon(LineWidth=7,Color="cyan");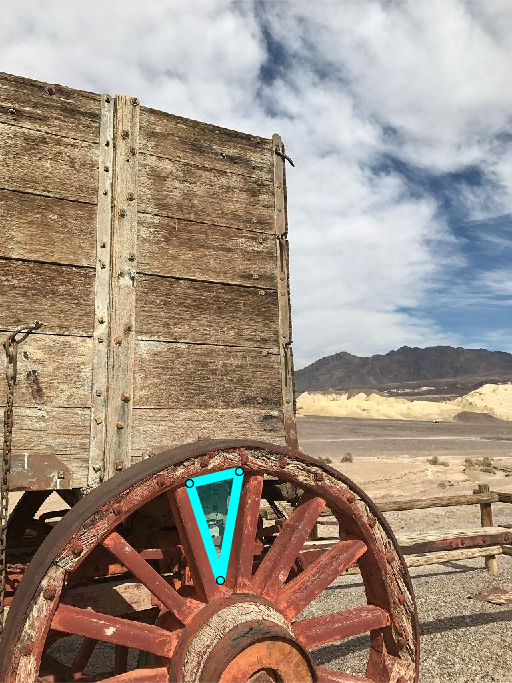
Get the coordinates of the vertices.
p.Position
ans =

  284.7500  725.5000
  331.2500  871.0000
  359.7500  707.5000
The spokes of the wheels define many other triangles. Suppose you want to get the
vertices of a second triangle. You can use the draw function to start
over and begin drawing a new polygonal ROI interactively. The line width and color
parameters of the ROI are preserved.
draw(p)
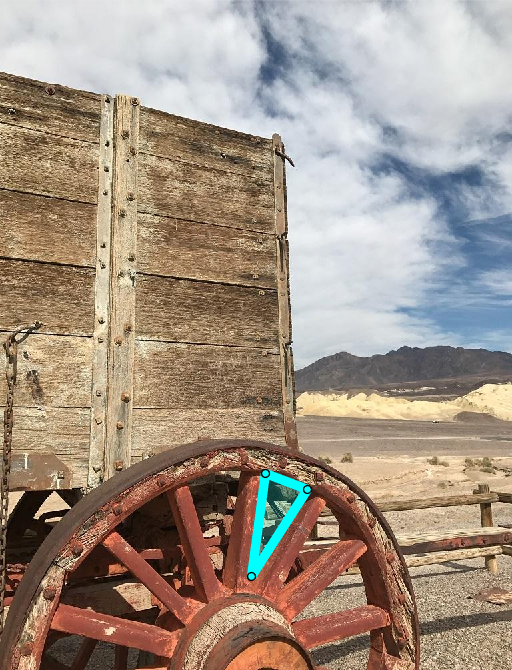
p.Position
ans =

  398.7500  710.5000
  377.7500  865.0000
  461.7500  734.5000
Input Arguments
Version History
Introduced in R2018b
See Also
beginDrawingFromPoint | drawassisted | drawcircle | drawcuboid | drawellipse | drawfreehand | drawline | drawpoint | drawpolygon | drawpolyline | drawrectangle