multithresh
R2026bMultilevel image thresholds using Otsu’s method
Description
thresh = multithresh(I)thresh from grayscale image
I, using Otsu's method [1]. Otsu's method chooses a threshold that
minimizes the intraclass variance of the thresholded pixels.
You can use the threshold thresh with the imquantize function to convert a grayscale image to a two-level image.
thresh = multithresh(I,N)thresh for N
threshold values.
You can use the threshold thresh with the imquantize function to convert a grayscale image into an image with
N+1 discrete levels.
Examples
Read and display an image.
I = imread("coins.png");
imshow(I)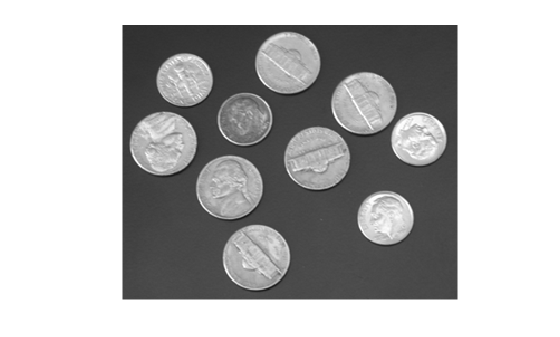
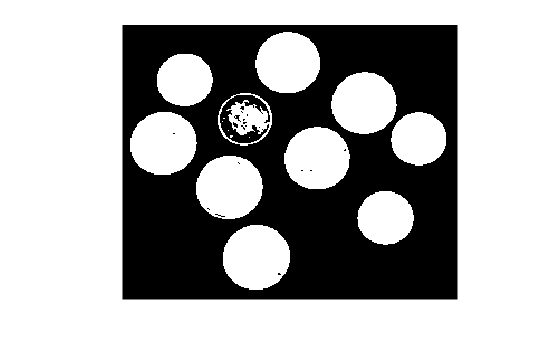
Calculate a single threshold value for the image.
level = multithresh(I);
Segment the image into two regions using the imquantize function, specifying the threshold level returned by the multithresh function. Display the result.
seg_I = imquantize(I,level);
imshow(seg_I,[])
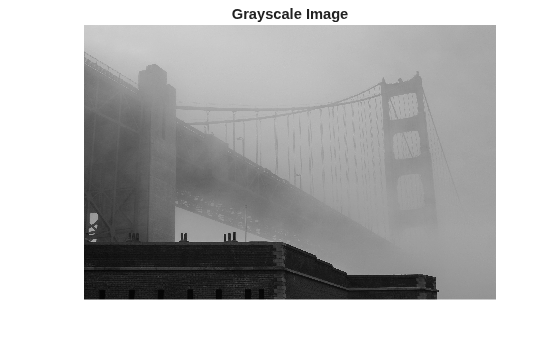
Read an image, convert it to grayscale, and display the result.
I = imread("foggysf2.jpg");
I = rgb2gray(I);
imshow(I)
title("Grayscale Image")
Calculate two threshold levels.
thresh = multithresh(I,2);
Segment the image into three levels using the imquantize function.
labels = imquantize(I,thresh);
Convert the segmented image into a color image using the label2rgb function, and display the image.
labelsRGB = label2rgb(labels);
imshow(labelsRGB)
title("Segmented Image")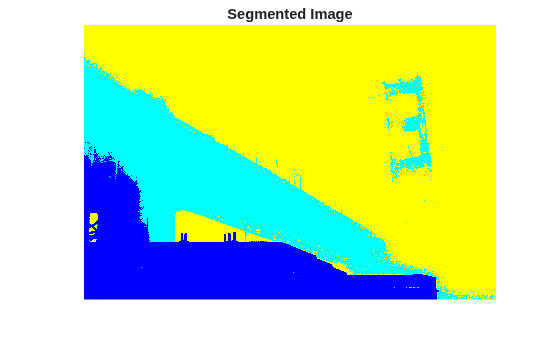
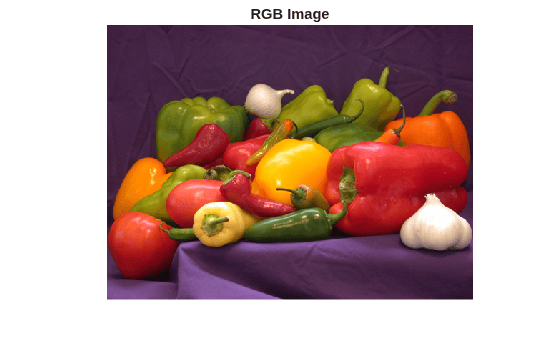
Read and display an RGB image.
I = imread("peppers.png");
imshow(I)
title("RGB Image");
Generate thresholds for seven levels from the entire RGB image.
threshRGB = multithresh(I,7);
Generate thresholds for each plane of the RGB image.
threshForPlanes = zeros(3,7);

for i = 1:3
    threshForPlanes(i,:) = multithresh(I(:,:,i),7);
end
Process the entire image with the set of threshold values computed from entire image.
value = [0 threshRGB(2:end) 255];
quantRGB = imquantize(I, threshRGB, value);
Process each RGB plane separately using the threshold vector computed from the given plane. Quantize each RGB plane using threshold vector generated for that plane.
quantPlane = zeros(size(I));

for i = 1:3
    value = [0 threshForPlanes(i,2:end) 255];
    quantPlane(:,:,i) = imquantize(I(:,:,i),threshForPlanes(i,:),value);
end

quantPlane = uint8(quantPlane);
Display both posterized images and note the visual differences in the two thresholding schemes.
montage({quantRGB,quantPlane})
title("Full RGB Image Quantization vs. Plane-by-Plane Quantization")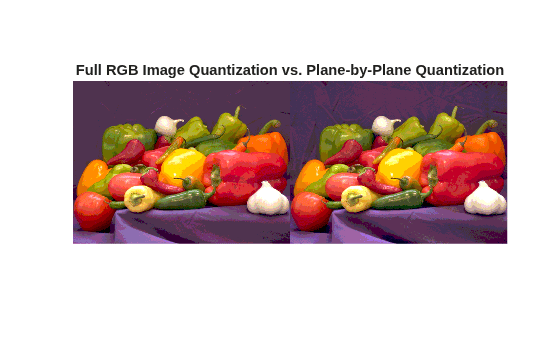
To compare the results, calculate the number of unique RGB pixel vectors in each output image. Note that the plane-by-plane thresholding scheme yields about 23% more colors than the full RGB image scheme.
dim = size(quantRGB);
quantRGBmx3 = reshape(quantRGB,prod(dim(1:2)),3);
quantPlanemx3 = reshape(quantPlane,prod(dim(1:2)),3);

colorsRGB = unique(quantRGBmx3,"rows");
disp("Unique colors in RGB image: "+length(colorsRGB));
Unique colors in RGB image: 188
colorsPlane = unique(quantPlanemx3,"rows");
disp("Unique colors in plane-by-plane image: "+length(colorsPlane));
Unique colors in plane-by-plane image: 231
Read an image.
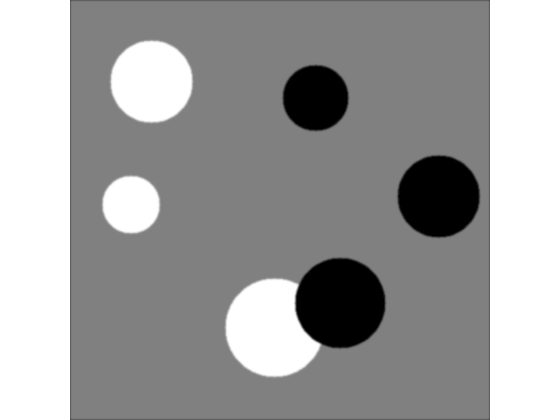
I = imread("circlesBrightDark.png");Count the number of unique grayscale values in the image.
uniqLevels = unique(I(:));
disp("Number of unique levels = "+length(uniqLevels));
Number of unique levels = 148
Display the image. Most pixels in the image have one of three colors: white, black, and medium-gray.
imageshow(I)
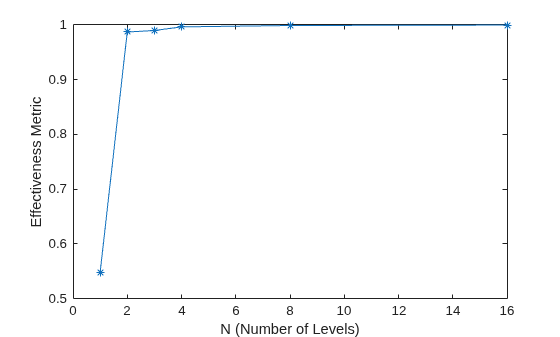
For increasing values of N, calculate the effectiveness of thresholding the image into N+1 levels.
N = [1 2 3 4 8 16];
metric = zeros(size(N));
for n = 1:length(N)
    [~, metric(n)] = multithresh(I,N(n));
end
Plot the effectiveness metric for each value of N. The knee of the curve occurs when N is 2.
plot(N,metric,"*-")
xlabel("N (Number of Levels)")
ylabel("Effectiveness Metric")
Calculate the threshold values for two threshold levels.
N = 2;
thresh = multithresh(I,N);
Convert the image into a 3-level image by using the imquantize function with the two threshold values. The quantized image has a clear separation of levels without oversegmentation.
imSeg = imquantize(I,thresh);
imageshow(imSeg,DisplayRangeMode="data-range");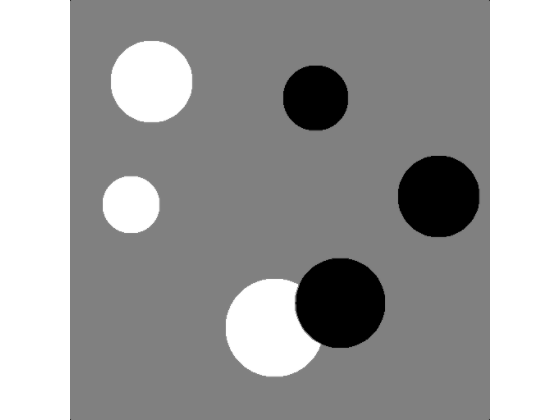
Input Arguments
Output Arguments
Algorithms
multithresh finds the thresholds based on the aggregate histogram of
the entire image I. multithresh considers an RGB image
as a 3-D numeric array and computes the thresholds for the combined data from all three color
planes.
multithresh uses the range of the input image I,
[min(I(:)) max(I(:))], as the limits for computing the histogram used in
subsequent computations. multithresh ignores any NaNs in
computation. Any Infs and -Infs are counted in the first
and last bin of the histogram, respectively.
For degenerate inputs where the number of unique values in I is less
than or equal to N, there is no viable solution using Otsu's method. For
such inputs, the return value thresh contains all the unique values from
I and possibly some extra values that are chosen arbitrarily.
References
[1] Otsu, N., "A Threshold Selection Method from Gray-Level Histograms." IEEE Transactions on Systems, Man, and Cybernetics. Vol. 9, No. 1, 1979, pp. 62–66.
Extended Capabilities
Version History
Introduced in R2012b

