plotSFR
Plot spatial frequency response of edge
Description
plotSFR( plots the
spatial frequency response (SFR) measurement of slanted edge ROIs.sharpnessMeasurements)
plotSFR(
plots the SFR, specifying additional parameters to control aspects of the
display.sharpnessMeasurements,Name=Value)
Examples
This example shows how to display the spatial frequency response (SFR) plot of a specified subset of the 60 slanted edge ROIs on an Imatest® eSFR chart.
Read an image of an eSFR chart into the workspace.
I = imread("eSFRTestImage.jpg");Create an esfrChart object, then display the chart with ROI annotations. The 60 slanted edge ROIs are labeled with green numbers.
chart = esfrChart(I);
displayChart(chart,displayGrayROIs=false,...
    displayColorROIs=false,displayRegistrationPoints=false)
Measure the edge sharpness in all ROIs and return the measurements in sharpnessTable.
sharpnessTable = measureSharpness(chart);
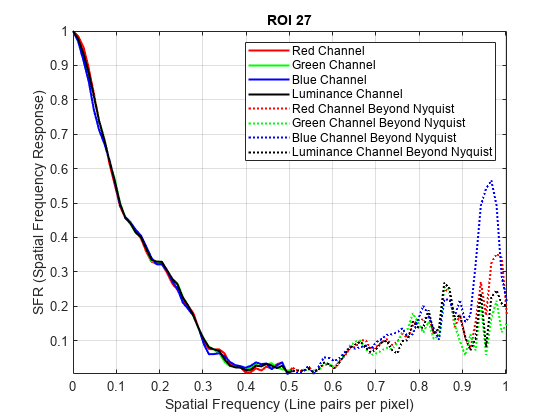
Display the SFR plot of ROIs 26 and 27 only.
plotSFR(sharpnessTable,ROIIndex=[26 27]);


Input Arguments
SFR measurements of edges, specified as a table. The
plotSFR function supports two types of measurements
as described in the following table. You can get both types of sharpness
measurements by using the measureSharpness function.
| Measurement | Description |
|---|---|
| Sharpness of individual ROIs |
|
| Average sharpness over all ROIs with a particular orientation |
When
|
Data Types: table
Name-Value Arguments
Specify optional pairs of arguments as
Name1=Value1,...,NameN=ValueN, where Name is
the argument name and Value is the corresponding value.
Name-value arguments must appear after other arguments, but the order of the
pairs does not matter.
Before R2021a, use commas to separate each name and value, and enclose
Name in quotes.
Example: plotSFR(myTable,"ROIIndex",2) displays the measured
sharpness only of ROI 2.
ROI indices to display, specified as an integer or vector of integers.
When
sharpnessMeasurementsrepresents the sharpness measurements of individual ROIs, by defaultplotSFRcreates only one figure, showing the SFR plot from the first row of the table.When
sharpnessMeasurementsis represents the average sharpness of all ROIs with a particular orientation,plotSFRignores the specifiedROIIndex. Instead,plotSFRcreates one figure for each orientation.
Example: 29:32
Data Types: single | double | int8 | int16 | int32 | uint8 | uint16 | uint32
Display plot legend, specified as a numeric or
logical 1 (true) or 0
(false). When displayLegend is
true, the SFR plot shows a legend that identifies
the different curves on the plot.
Display plot title, specified as a numeric or
logical 1 (true) or 0
(false). When displayTitle is
true, the SFR plot shows a title that indicates
the individual ROI index or the orientation of the averaged ROIs.
Parent of the displayed image object, specified as an
Axes object.
Version History
Introduced in R2017b
MATLAB Command
You clicked a link that corresponds to this MATLAB command:
Run the command by entering it in the MATLAB Command Window. Web browsers do not support MATLAB commands.
Select a Web Site
Choose a web site to get translated content where available and see local events and offers. Based on your location, we recommend that you select: .
You can also select a web site from the following list
How to Get Best Site Performance
Select the China site (in Chinese or English) for best site performance. Other MathWorks country sites are not optimized for visits from your location.
Americas
- América Latina (Español)
- Canada (English)
- United States (English)
Europe
- Belgium (English)
- Denmark (English)
- Deutschland (Deutsch)
- España (Español)
- Finland (English)
- France (Français)
- Ireland (English)
- Italia (Italiano)
- Luxembourg (English)
- Netherlands (English)
- Norway (English)
- Österreich (Deutsch)
- Portugal (English)
- Sweden (English)
- Switzerland
- United Kingdom (English)