Ship Detection from Sentinel-1 C Band SAR Data Using YOLOX Object Detection
R2026bThis example shows how to detect ships from Sentinel-1 C Band SAR Data using YOLOX object detection.
Synthetic aperture radar (SAR) remote sensing is an important method for marine monitoring due to its all-day, all-weather capability. Ship detection in SAR images plays a critical role in shipwreck rescue, fishery and traffic management, and other marine applications. SAR imagery provides data with high spatial and temporal resolution, which is useful for ship detection.
This example shows how to use a pretrained YOLOX object detection network to perform these tasks.
Detect ships in sample test image.
Detect ships in large-scale test image with block processing.
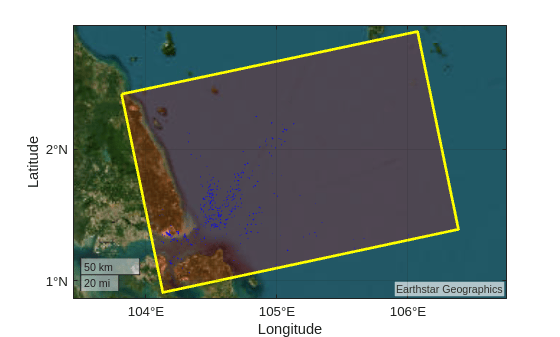
Plot the large-scale test image on the map and show the ships detected in the large-scale test image on the map.
Load Pretrained Network
Create a folder in which to store the pretrained YOLOX object detection network and test images. Download the pretrained network and load it into the workspace by using the helperDownloadObjectDetector helper function. The helper function is attached to this example as a supporting file.
dataDir = "shipDetection";
detector = helperDownloadObjectDetector(dataDir);
Detect Ships in Test Image Using Pretrained Network
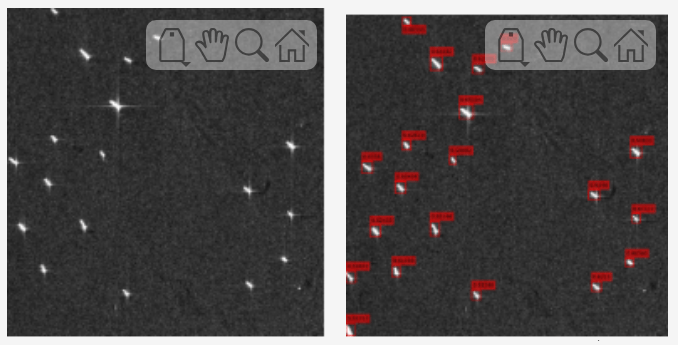
Read a sample test image and detect the ships it contains using the pretrained object detection network. The size of the test image is and must be the same as the size of the input to the object detection network. Use a threshold of 0.55 to reduce the false positives.
testImg = fullfile(dataDir,"SARShipDetectionYoloX","test1.jpg");
Img = imread(testImg);
[bboxes,scores,labels] = detect(detector,Img,Threshold=0.55);
Display the test image and the output with bounding boxes for the detected ships side by side.
detectedIm = insertObjectAnnotation(Img,"Rectangle",bboxes,scores,LineWidth=2,Color="red");
h = uifigure;
g = uigridlayout(h,ColumnWidth={"1x","1x"},RowHeight={"fit","1x"});
viewer1 = viewer2d(g,ScaleBar="off");
viewer2 = viewer2d(g,ScaleBar="off");
viewer1.Layout.Row = 1;
viewer1.Layout.Column = 1;
viewer2.Layout.Row = 1;
viewer2.Layout.Column = 2;
imageshow(Img,Parent=viewer1);
imageshow(detectedIm,Parent=viewer2);
Detect Ships in Large-Scale Test Image Using Pretrained Network
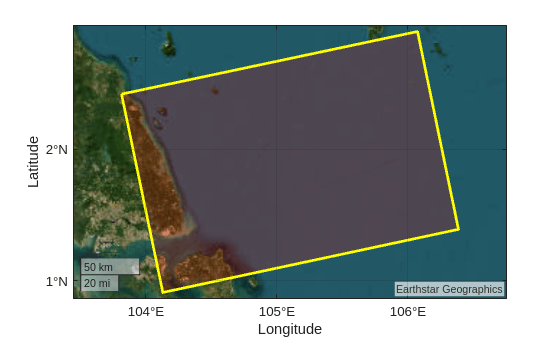
Create a large-scale test image of the Singapore Strait region. Get the world x-y coordinates representing the geographic extent of the region using mappolyshape (Mapping Toolbox) object.
lat = [2.420848 2.897566 1.389878 0.908674 2.420848];
lon = [103.816467 106.073883 106.386215 104.131699 103.816467];
p = projcrs(32648);
[xb,yb] = projfwd(p,lat,lon);
dataRegion = mappolyshape(xb,yb);
dataRegion.ProjectedCRS = p;
Plot the region of interest using satellite imagery.
figure
geoplot(dataRegion, ...
    LineWidth=2, ...
    EdgeColor="yellow", ...
    FaceColor="red", ...
    FaceAlpha=0.2)
geobasemap satellite
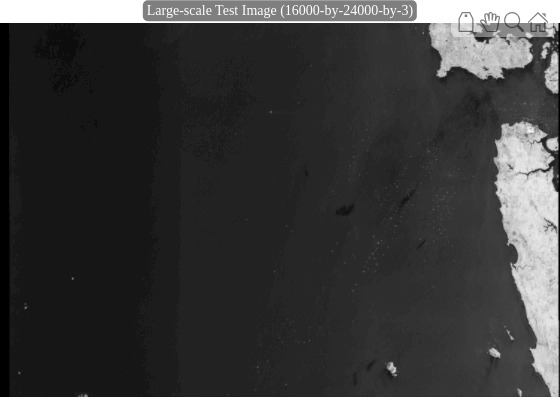
To perform ship detection on the large-scale image, use the blockedImage object. You can use this object to load a large-scale image and process it on systems with limited resources.
Create the blocked image. Display the image using the imageshow function.
largeImg = fullfile(dataDir,"SARShipDetectionYoloX","test-ls.jpg");
bim = blockedImage(largeImg);
bim = makeMultiLevel2D(bim,Scales=[1 0.5 0.125 0.0625]);
hbim = imageshow(bim);
hbim.Parent.Title = "Large-scale Test Image (16000-by-24000-by-3)";Set the block size to the input size of the detector.
blockSize = [640 640 3];
Create a function handle to the detectShipsLargeImage helper function. The helper function, which contains the ship detection algorithm definition, is attached to this example as a supporting file.
detectionFcn = @(bstruct) detectShipsLargeImage(bstruct,detector);
Produce a processed blocked image bimProc with annotations for the bounding boxes by using the apply object function with the detectionFcn function handle. This function call also saves the bounding boxes in the getBboxes MAT file.
bimProc = apply(bim,detectionFcn,BlockSize=blockSize);
Display the output with bounding boxes containing the detected ships.
bimProc = makeMultiLevel2D(bimProc,Scales=[1 0.5 0.1 0.01]);
hbim = imageshow(bimProc);
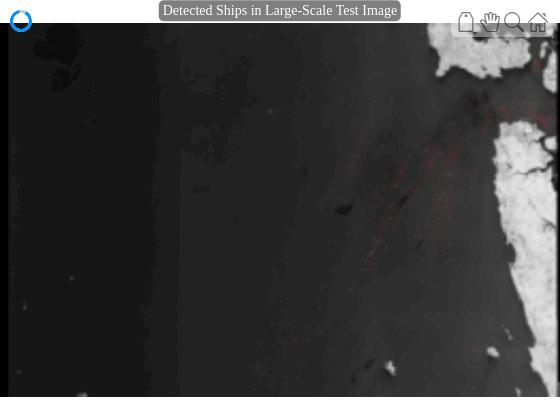
hbim.Parent.Title="Detected Ships in Large-Scale Test Image";A bounding box indicates the region of interest (ROI) of the detected ship. Get the world coordinates of the detected ship ROIs from the bounding boxes using the getBboxesWorldCoords helper function. The getBboxesWorldCoords helper function is attached to this example as a supporting file. Because the image metadata is not available, the helper function manually creates the spatial referencing object by setting image attributes such as pixel spacing and affine rotation.
Store the x- and y- world coordinates of the ship bounding boxes in the polyX and polyY cell arrays, respectively.
[polyX,polyY] = getBboxesWorldCoords(xb,yb,p);
Create a mappolyshape (Mapping Toolbox) object using the polyX and polyY cell arrays containing the world coordinates for ship bounding boxes.
shape = mappolyshape(polyX, polyY);
shape.ProjectedCRS = p;
Visualize the ship ROIs in a geographic axes with the data region.
figure
geoplot(dataRegion, ...
    LineWidth=2, ...
    EdgeColor="yellow", ...
    FaceColor="red", ...
    FaceAlpha=0.2)
hold on
geoplot(shape, ...
    EdgeColor="blue", ...
    FaceColor="cyan", ...
    FaceAlpha=0.2)
geobasemap satellite
See Also
blockedImage | apply | yoloxObjectDetector (Visual Inspection Toolbox) | evaluateObjectDetection (Computer Vision Toolbox)

