mapclip
Description
clipped = mapclip(shape,xlimits,ylimits)shape, the
x-limits using xlimits, and the
y-limits using ylimits.
To crop raster data that is represented by an array and a map raster reference object,
use the mapcrop function
instead.
clipped = mapclip(shape,clipperPolygon)
Examples
Read hydrography data as a geospatial table. Extract the polygon shape for a pond.
hydro = readgeotable("concord_hydro_area.shp");
shape = hydro.Shape(14)
shape =
mappolyshape with properties:
NumRegions: 1
NumHoles: 3
Geometry: "polygon"
CoordinateSystemType: "planar"
ProjectedCRS: [1×1 projcrs]
Specify the xy-limits and clip the shape.
xlimits = [207736  208212];
ylimits = [912283  912636];
clipped = mapclip(shape,xlimits,ylimits);
Display the shape and the clipped shape on a map.
figure
geoplot(shape)
hold on
geoplot(clipped)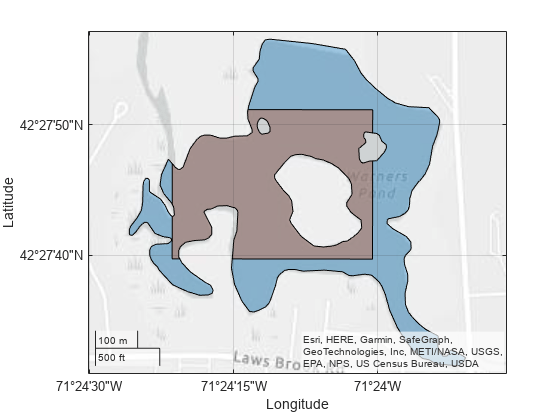
Since R2024b
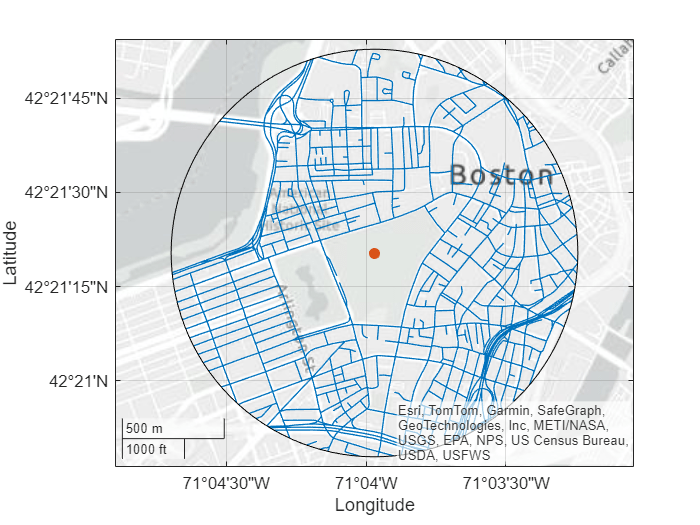
Read road data for an area in Boston as a geospatial table. The table represents the roads using line shapes in planar coordinates. Extract the line shapes.
roads = readgeotable("boston_roads.shp");
shape = roads.Shapeshape=2795×1 maplineshape array with properties:
NumParts: [2795×1 double]
Geometry: "line"
CoordinateSystemType: "planar"
ProjectedCRS: [1×1 projcrs]
⋮
Specify the clipper polygon. Create a geospatial table that contains a point shape object for a named location in Boston. Then, define an area of interest (AOI) by creating a circle with a radius of 1000 meters that is centered on the point shape.
places = readgeotable("boston_placenames.shp");
flagstaff = geocode("FLAGSTAFF HILL",places);

clipperPolygon = aoicircle(flagstaff,1000)
clipperPolygon =
  mappolyshape with properties:

              NumRegions: 1
                NumHoles: 0
                Geometry: "polygon"
    CoordinateSystemType: "planar"
            ProjectedCRS: [1×1 projcrs]
Verify that the road data and the AOI use the same projected coordinate reference system (CRS).
isequal(shape.ProjectedCRS,clipperPolygon.ProjectedCRS)
ans = logical
   1
Clip the road data to the AOI.
clipped = mapclip(shape,clipperPolygon);
Create a map that displays the clipped road data, the named location, and the AOI.
figure
geoplot(clipped,LineWidth=0.8)
hold on
geoplot(flagstaff,MarkerSize=20)
geoplot(clipperPolygon,FaceColor="none")
Read the names and locations of places in Boston as a geospatial table. Extract the point shapes.
places = readgeotable("boston_placenames.shp");
shape = places.Shape
shape =
13×1 mappointshape array with properties:
NumPoints: [13×1 double]
X: [13×1 double]
Y: [13×1 double]
Geometry: "point"
CoordinateSystemType: "planar"
ProjectedCRS: [1×1 projcrs]
Specify the xy-limits and clip the shapes.
xlimits = [235226 237174];
ylimits = [900179 901059];
clipped = mapclip(shape,xlimits,ylimits);
When a point shape lies outside the specified limits, the clipped shape has no coordinate data and the NumPoints property is 0. Remove shapes with no coordinate data from the clipped shapes.
idx = clipped.NumPoints ~= 0;
clipped = clipped(idx)
clipped =
  5×1 mappointshape array with properties:

               NumPoints: [5×1 double]
                       X: [5×1 double]
                       Y: [5×1 double]
                Geometry: "point"
    CoordinateSystemType: "planar"
            ProjectedCRS: [1×1 projcrs]
When a line or polygon shape has no coordinate data, its respective the NumParts or NumRegions property is 0.
If your shape is in projected coordinates and your limits are in geographic coordinates, then you must project the geographic coordinates before clipping the shape. To use this approach:
You must know the projected coordinate reference system (CRS) for the shape. You can determine whether a shape object is associated with a projected CRS by querying the
ProjectedCRSproperty.The projection method for the CRS must result in x-coordinates and y-coordinates that run approximately west-to-east and south-to-north, respectively, such as transverse Mercator or Lambert Conic Conformal. This approach is not valid for projection methods such as polar stereographic. You can find the projection method for a projected CRS object by querying the
ProjectionMethodproperty.
Read road data for an area in Concord, MA as a geospatial table. Extract the line shapes.
roads = readgeotable("concord_roads.shp");
shape = roads.Shapeshape=609×1 maplineshape array with properties:
NumParts: [609×1 double]
Geometry: "line"
CoordinateSystemType: "planar"
ProjectedCRS: [1×1 projcrs]
⋮
Verify that the shape has a projected CRS with an appropriate projection method.
crs = shape.ProjectedCRS
crs =
  projcrs with properties:

                    Name: "NAD83 / Massachusetts Mainland"
           GeographicCRS: [1×1 geocrs]
        ProjectionMethod: "Lambert Conic Conformal (2SP)"
              LengthUnit: "meter"
    ProjectionParameters: [1×1 map.crs.ProjectionParameters]
Specify the latitude and longitude limits using geographic coordinates. Project the latitude and longitude limits to xy-limits by using the projected CRS and the projfwd function.
latlim = [42.4657 42.4687];
lonlim = [-71.3996 -71.3946];
[xlimits,ylimits] = projfwd(crs,latlim,lonlim);
Clip the shapes.
clipped = mapclip(shape,xlimits,ylimits);
Display the clipped shapes on a map. Compare the limits you specified with the limits of the plot by setting the tick format to decimal degrees.
figure
geoplot(clipped)
geotickformat("dd")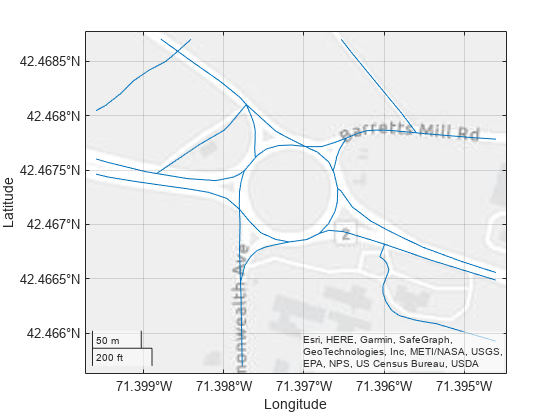
Input Arguments
Output Arguments
Tips
If you clip a shape within a geospatial table, the function does not modify any attributes of the table.