stem3m
Project stem plot on axesm-based map
Syntax
h = stem3m(lat,lon,z)

h = stem3m(lat,lon,z,LineSpec)

h = stem3m(lat,lon,z,PropertyName,PropertyValue,...)
Description
h = stem3m(lat,lon,z) displays a stem plot on the
current axesm-based map. Stems are located at the points
(lat,lon) and extend from an altitude of 0 to
the values of z. The coordinate inputs should be in the same
AngleUnits as the axesm-based map. It is
important to note that the selection of z-values will greatly
affect the 3-D look of the plot. Regardless of AngleUnits, the
x and y limits of the
axesm-based map are at most -π to +π and -π/2 to +π/2,
respectively. This means that for most purposes, appropriate z values
would be on the order of 1 to 3, not 10 to 30. The axes
DataAspectRatio property can be used to adjust the appearance
of the graphic. The handles of the displayed stem lines can be returned in
h.
h = stem3m(lat,lon,z,
specifies the line style,
marker, and color.LineSpec)
h = stem3m(lat,lon,z, allows
any property/value pair recognized by the MATLAB® PropertyName,PropertyValue,...)line function
to be specified for the stems.
A stem plot displays data as lines extending normal to the xy-plane, in this case, on a map.
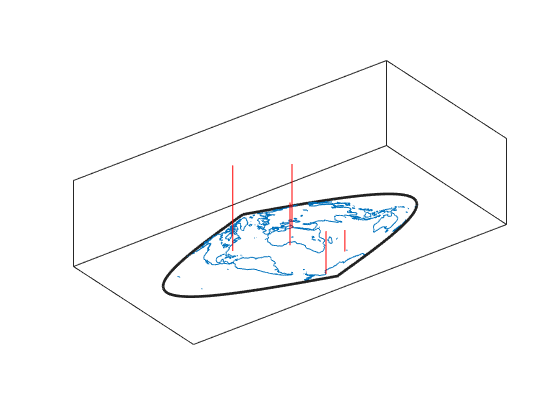
Examples
Project a stem plot on a map.
load coastlines
axesm sinusoid;
view(3)
h = framem;
set(h,'zdata',zeros(size(coastlat)))
plotm(coastlat,coastlon)
ptlat = [0 30 30 -50 -78]';
ptlon = [0 30 -70 65 -35]';
ptz = [1 1.5 2 .5 1]';
stem3m(ptlat,ptlon,ptz,'r-')
More About
Specify the line style, marker, and color as a character vector or string containing symbols.
The symbols can appear in any order. You do not need to specify all three characteristics
(line style, marker, and color). For example, specify a red dashed line using
'--r'.
| Line Style | Description | Resulting Line |
|---|---|---|
"-" | Solid line |
|
"--" | Dashed line |
|
":" | Dotted line |
|
"-." | Dash-dotted line |
|
| Marker | Description | Resulting Marker |
|---|---|---|
"o" | Circle |
|
"+" | Plus sign |
|
"*" | Asterisk |
|
"." | Point |
|
"x" | Cross |
|
"_" | Horizontal line |
|
"|" | Vertical line |
|
"square" | Square |
|
"diamond" | Diamond |
|
"^" | Upward-pointing triangle |
|
"v" | Downward-pointing triangle |
|
">" | Right-pointing triangle |
|
"<" | Left-pointing triangle |
|
"pentagram" | Pentagram |
|
"hexagram" | Hexagram |
|
| Color Name | Short Name | RGB Triplet | Appearance |
|---|---|---|---|
"red" | "r" | [1 0 0] |
|
"green" | "g" | [0 1 0] |
|
"blue" | "b" | [0 0 1] |
|
"cyan"
| "c" | [0 1 1] |
|
"magenta" | "m" | [1 0 1] |
|
"yellow" | "y" | [1 1 0] |
|
"black" | "k" | [0 0 0] |
|
"white" | "w" | [1 1 1] |
|
Version History
Introduced before R2006a