Specify Axis Tick Values and Labels
Customizing the tick values and labels along an axis can help highlight particular aspects of your data. These examples show some common customizations, such as modifying the tick value placement, changing the tick label text and formatting, and rotating the tick labels.
Change Tick Value Locations and Labels
Create x as 200 linearly spaced values between -10 and 10. Create y as the cosine of x. Plot the data.
x = linspace(-10,10,200);
y = cos(x);
plot(x,y)

Change the tick value locations along the x-axis and y-axis. Specify the locations as a vector of increasing values. The values do not need to be evenly spaced.
Also, change the labels associated with each tick value along the x-axis. Specify the labels using a cell array of character vectors. To include special characters or Greek letters in the labels, use TeX markup, such as \pi for the symbol.
xticks([-3*pi -2*pi -pi 0 pi 2*pi 3*pi])
xticklabels({'-3\pi','-2\pi','-\pi','0','\pi','2\pi','3\pi'})
yticks([-1 -0.8 -0.2 0 0.2 0.8 1])
For releases prior to R2016b, instead set the tick values and labels using the XTick, XTickLabel, YTick, and YTickLabel properties of the Axes object. For example, assign the Axes object to a variable, such as ax = gca. Then set the XTick property using dot notation, such as ax.XTick = [-3*pi -2*pi -pi 0 pi 2*pi 3*pi]. For releases prior to R2014b, use the set function to set the property instead.
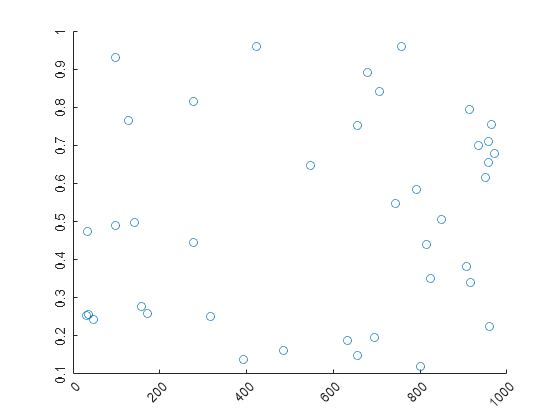
Rotate Tick Labels
Create a scatter plot and rotate the tick labels along each axis. Specify the rotation as a scalar value. Positive values indicate counterclockwise rotation. Negative values indicate clockwise rotation.
x = 1000*rand(40,1);
y = rand(40,1);
scatter(x,y)
xtickangle(45)
ytickangle(90)
For releases prior to R2016b, specify the rotation using the XTickLabelRotation and YTickLabelRotation properties of the Axes object. For example, assign the Axes object to a variable, such as ax = gca. Then set the XTickLabelRotation property using dot notation, such as ax.XTickLabelRotation = 45.
Change Tick Label Formatting
Create a stem chart and display the tick label values along the y-axis as US dollar values.
profit = [20 40 50 40 50 60 70 60 70 60 60 70 80 90];
stem(profit)
xlim([0 15])
ytickformat('usd')
For more control over the formatting, specify a custom format. For example, show one decimal value in the x-axis tick labels using '%.1f'. Display the y-axis tick labels as British Pounds using '\xA3%.2f'. The option \xA3 indicates the Unicode character for the Pound symbol. For more information on specifying a custom format, see the xtickformat function.
xtickformat('%.1f')
ytickformat('\xA3%.2f')

Ruler Objects for Individual Axis Control
MATLAB creates a ruler object for each axis. Like all graphics objects, ruler objects have properties that you can view and modify. Ruler objects allow for more individual control over the formatting of the x-axis, y-axis, or z-axis. Access the ruler object associated with a particular axis through the XAxis, YAxis, or ZAxis property of the Axes object. The type of ruler depends on the type of data along the axis. For numeric data, MATLAB creates a NumericRuler object.
ax = gca;
ax.XAxis
ans =
  NumericRuler with properties:

             Limits: [0 15]
              Scale: 'linear'
           Exponent: 0
         TickValues: [0 5 10 15]
    TickLabelFormat: '%.1f'

  Show all properties
Control Value of Exponent in Secondary Label Using Ruler Objects
Plot data with y values that range between -15,000 and 15,000. By default, the y-axis tick labels use exponential notation with an exponent value of 4 and a base of 10. Change the exponent value to 2. Set the Exponent property of the ruler object associated with the y-axis. Access the ruler object through the YAxis property of the Axes object. The secondary label and the tick labels change accordingly.
x = linspace(0,5,1000);
y = 100*exp(x).*sin(20*x);
plot(x,y)

ax = gca;
ax.YAxis.Exponent = 2;

Change the exponent value to 0 so that the tick labels do not use exponential notation.
ax.YAxis.Exponent = 0;

See Also
Functions
xlim|xticks|yticks|zticks|xtickformat|xtickangle|xsecondarylabel|ysecondarylabel