xticks
Set or query x-axis tick values
Description
xticks( sets
the x-axis tick values, which are the locations along
the x-axis where the tick marks appear. Specify ticks)ticks as
a vector of increasing values; for example, [0 2 4 6].
This command affects the current axes.
xt = xticks
xticks('auto') sets an automatic mode,
enabling the axes to determine the x-axis tick
values. Use this option if you change the tick values and then want
to set them back to the default values.
xticks('manual') sets a manual mode, freezing
the x-axis tick values at the current values.
Use this option if you want to retain the current tick values when
resizing the axes or adding new data to the axes.
m = xticks('mode')'auto' or 'manual'. By
default, the mode is automatic unless you specify tick values or change
the mode to manual.
Examples
Create a line plot. Display tick marks along the x-axis at the values 0, 5, and 10. Then specify a label for each tick mark.
x = linspace(0,10);
y = x.^2;
plot(x,y)
xticks([0 5 10])
xticklabels({'x = 0','x = 5','x = 10'})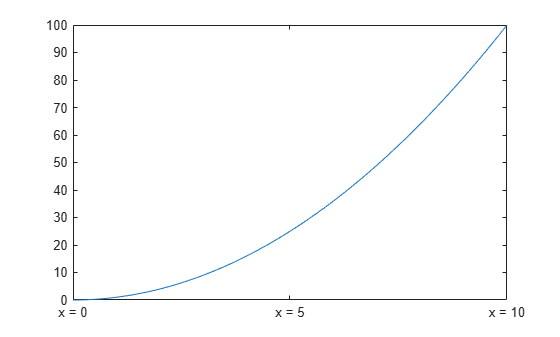
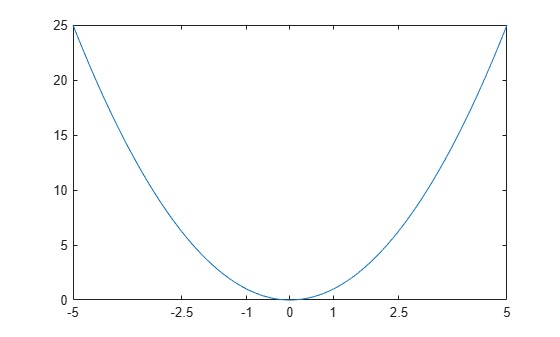
Display tick marks along the x-axis at nonuniform values between -5 and 5. MATLAB® labels the tick marks with the numeric values.
x = linspace(-5,5);
y = x.^2;
plot(x,y)
xticks([-5 -2.5 -1 0 1 2.5 5])
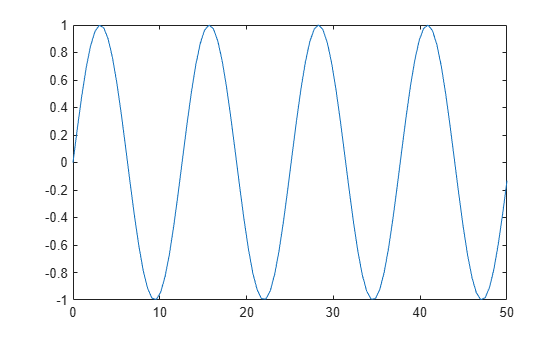
Display tick marks along the x-axis at increments of 10, starting from 0 and ending at 50.
x = linspace(0,50);
y = sin(x/2);
plot(x,y)
xticks(0:10:50)
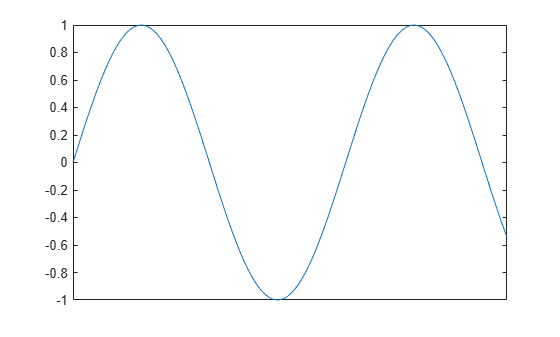
Create a line plot. Specify the x-axis limits as 0 to . Then, display tick marks along the x-axis at increments of .
x = linspace(0,6*pi);
y = sin(x);
plot(x,y)
xlim([0 6*pi])
xticks(0:pi:6*pi)
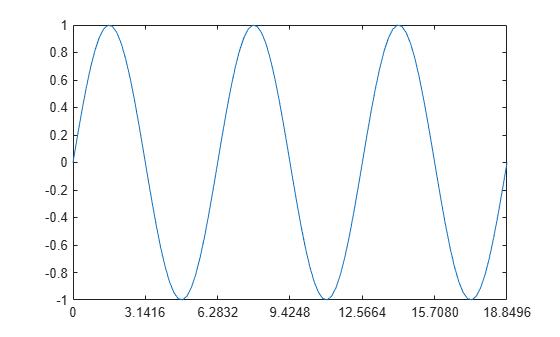
MATLAB® labels the tick marks with the numeric values. Change the labels to show the symbol by specifying the text for each label.
xticklabels({'0','\pi','2\pi','3\pi','4\pi','5\pi','6\pi'})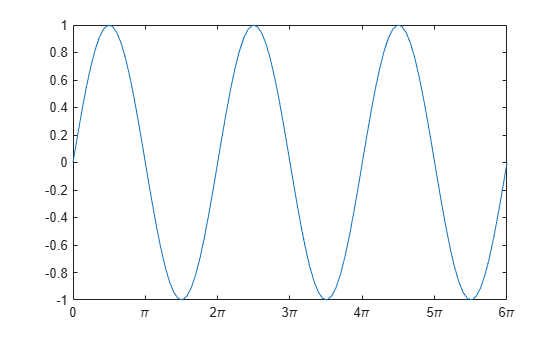
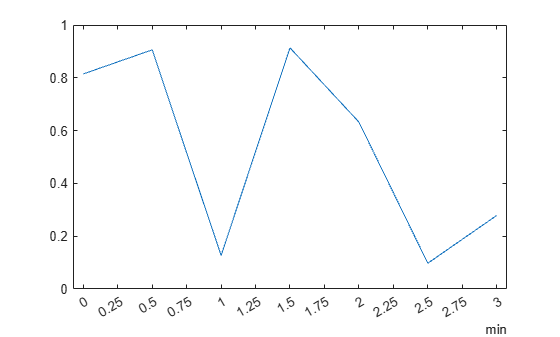
Create a plot with duration values along the x-axis. Then, change the duration values where the tick marks are located.
t = minutes(0:.5:3);
y = rand(1,7);
plot(t,y)
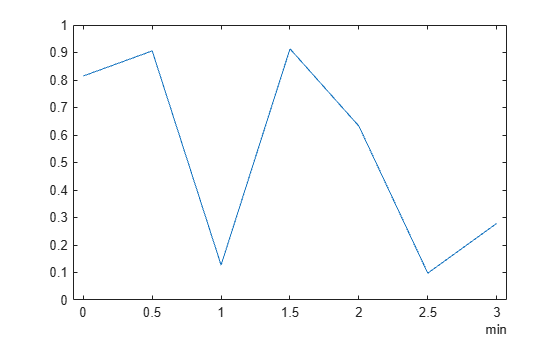
ticks = minutes(0:.25:3);
xticks(ticks)
Create a stem chart and specify the x-axis tick values. Then, set the x-axis tick values back to the default values.
stem(1:10)
xticks([0 4 6 10])
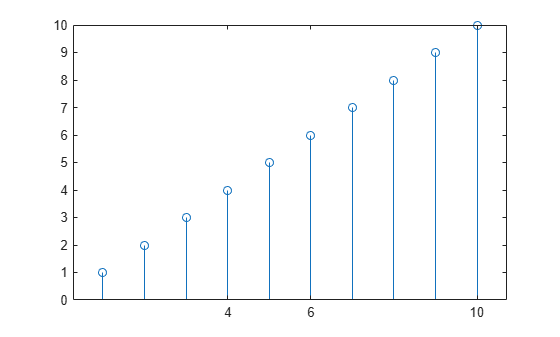
xticks('auto')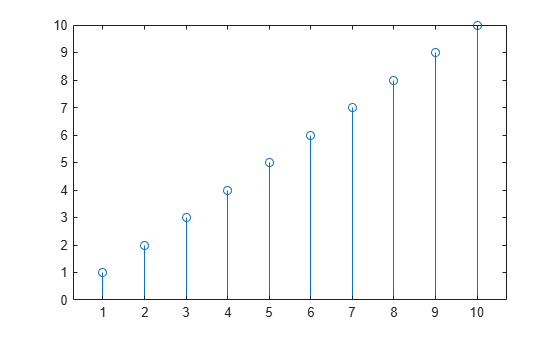
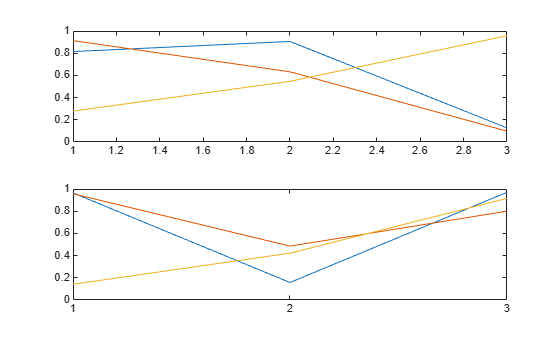
Starting in R2019b, you can display a tiling of plots using the tiledlayout and nexttile functions. Call the tiledlayout function to create a 2-by-1 tiled chart layout. Call the nexttile function to create the axes objects ax1 and ax2. Plot random data into each axes. Then set the x-axis tick values for the lower plot by passing ax2 as the first input argument to the xticks function.
tiledlayout(2,1)
ax1 = nexttile;
plot(rand(3))
ax2 = nexttile;
plot(rand(3))
xticks(ax2,[1 2 3])
Remove the tick marks along the x-axis by specifying the tick values as an empty array.
x = linspace(0,10);
y = sin(x);
plot(x,y)
xticks([])
Input Arguments
Output Arguments
More About
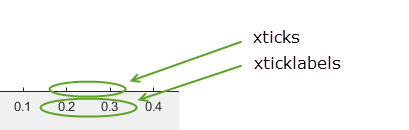
The tick values are the locations along the x-axis where
the tick marks appear. The tick labels are the labels that you see for each tick
mark. Set the values using the xticks function. Set the
corresponding labels using the xticklabels function.
Algorithms
The xticks function sets and queries several
axes properties related to the x-axis tick values.
Version History
Introduced in R2016b