View Cyclone Track Data in Geographic Density Plot
This example shows how to view cyclone tracking data in a geographic density plot. The data records observations of cyclones over an 11 year period, between 2007-2017.
Load the cyclone track data. The data, produced by the Japan Meteorological Agency, records the location, pressure (in hPa), and wind speed (knots) of cyclones at six-hour intervals. Each row in the table represents the record of an observation of a particular cyclone, identified by a name and an ID number.
load cycloneTracks
To understand the data, plot the tracks of three cyclones, using the geoplot function. Get the data records for three cyclones, identified by ID number and name. Each observation record provides the latitude and longitude. Plot all the three cyclone tracks on one map by turning hold on.
figure
latMalakas = cycloneTracks.Latitude(cycloneTracks.ID == 1012);
lonMalakas = cycloneTracks.Longitude(cycloneTracks.ID == 1012);
geoplot(latMalakas,lonMalakas,'.-')
geolimits([0 60],[100 180])
hold on
latMegi = cycloneTracks.Latitude(cycloneTracks.ID == 1013);
lonMegi = cycloneTracks.Longitude(cycloneTracks.ID == 1013);
geoplot(latMegi,lonMegi,'.-')
latChaba = cycloneTracks.Latitude(cycloneTracks.ID == 1014);
lonChaba = cycloneTracks.Longitude(cycloneTracks.ID == 1014);
geoplot(latChaba,lonChaba,'.-')

View the density of all cyclones tracked over this 11-year period using geodensityplot. In this plot, instead of a seeing the track of a particular cyclone, view all the records at every point for all the cyclones. geodensityplot calculates a cumulative probability distribution surface using contributions from the individual locations. The surface transparency varies with density.
figure
latAll = cycloneTracks.Latitude;
lonAll = cycloneTracks.Longitude;
geodensityplot(latAll,lonAll)
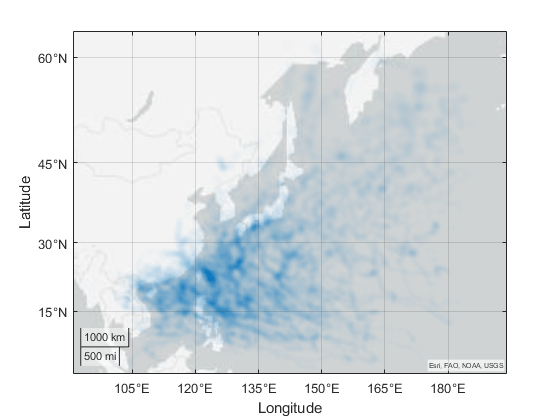
By default, geodensityplot uses a single color to represent all density values, using transparency to represent density variation. You can also use multiple colors with geodensityplot to represent areas of varying density. To do this, set the 'FaceColor' property.
geodensityplot(latAll,lonAll,'FaceColor','interp')
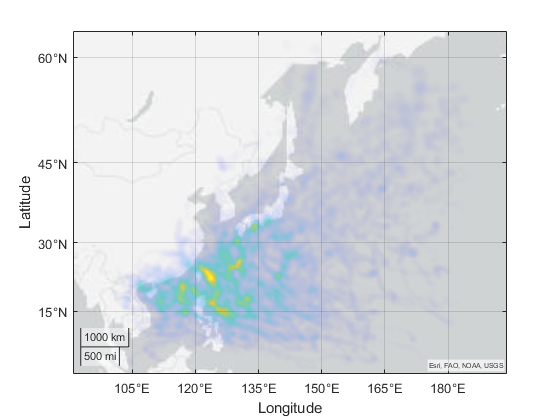
A density plot can apply weights to individual data points. The weights multiply the contribution of individual points to the density surface.
windspeedAll = cycloneTracks.WindSpeed;
geodensityplot(latAll,lonAll,windspeedAll,'FaceColor','interp')

Reference: This cyclone track data was modified for use in this example by MathWorks from the RSMC Best Track Data by the Japan Meteorological Agency (https://www.jma.go.jp/jma/jma-eng/jma-center/rsmc-hp-pub-eg/RSMC_HP.htm).
See Also
geodensityplot | DensityPlot Properties
Related Topics
You can also select a web site from the following list:
Americas
- América Latina (Español)
- Canada (English)
- United States (English)
Europe
- Belgium (English)
- Denmark (English)
- Deutschland (Deutsch)
- España (Español)
- Finland (English)
- France (Français)
- Ireland (English)
- Italia (Italiano)
- Luxembourg (English)
- Netherlands (English)
- Norway (English)
- Österreich (Deutsch)
- Portugal (English)
- Sweden (English)
- Switzerland
- United Kingdom (English)