gammainc
Regularized incomplete gamma function
Description
Y = gammainc(X,A)X and
A. Both X and A must be real,
and A must be nonnegative.
Examples
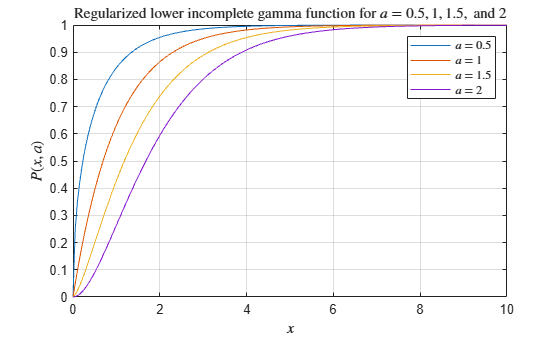
Calculate the regularized lower incomplete gamma function for = 0.5, 1, 1.5, and 2 within the interval . Loop over values of , evaluate the function at each one, and assign each result to a column of Y.
A = [0.5 1 1.5 2];
X = 0:0.05:10;
Y = zeros(201,4);
for i = 1:4
    Y(:,i) = gammainc(X,A(i));
end
Plot all of the functions in the same figure.
plot(X,Y)
grid on
legend('$a = 0.5$','$a = 1$','$a = 1.5$','$a = 2$','interpreter','latex')
title('Regularized lower incomplete gamma function for $a = 0.5, 1, 1.5,$ and $2$','interpreter','latex')
xlabel('$x$','interpreter','latex')
ylabel('$P(x,a)$','interpreter','latex')
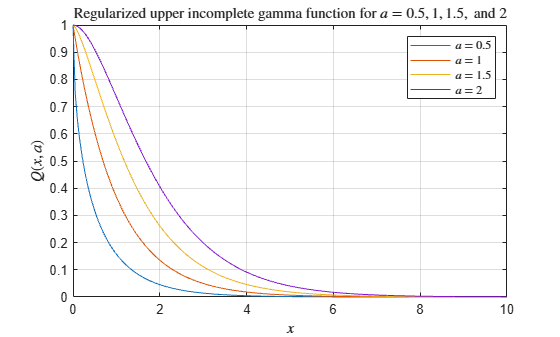
Calculate the regularized upper incomplete gamma function for = 0.5, 1, 1.5, and 2 within the interval . Loop over values of , evaluate the function at each one, and assign each result to a column of Y.
A = [0.5 1 1.5 2];
X = 0:0.05:10;
Y = zeros(201,4);
for i = 1:4
    Y(:,i) = gammainc(X,A(i),'upper');
end
Plot all of the functions in the same figure.
plot(X,Y)
grid on
legend('$a = 0.5$','$a = 1$','$a = 1.5$','$a = 2$','interpreter','latex');
title('Regularized upper incomplete gamma function for $a = 0.5, 1, 1.5,$ and $2$','interpreter','latex')
xlabel('$x$','interpreter','latex')
ylabel('$Q(x,a)$','interpreter','latex')
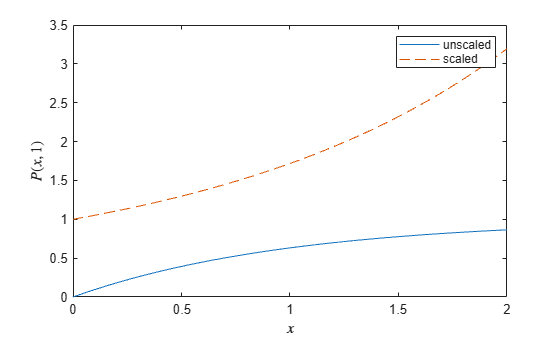
Calculate the unscaled regularized lower incomplete gamma function for within the interval . Plot the function.
a = 1;
x = 0:0.001:2;
Y = gammainc(x,a);
plot(x,Y);
xlabel('$x$','interpreter','latex');
ylabel('$P(x,1)$','interpreter','latex')
hold on
Next, calculate the scaled lower incomplete gamma function. Plot the function on the same graph. The scaled function has different asymptotic behavior near 0, which avoids underflow when is close to 0.
Ys = gammainc(x,a,'scaledlower');
plot(x,Ys,'--');
legend('unscaled','scaled')
Input Arguments
Limitations
When x is negative, the regularized incomplete gamma function can be inaccurate for abs(x) > a+1.
More About
Tips
When the regularized upper incomplete gamma function is close to 0, specifying the
'upper'option to calculate the function is more accurate than subtracting the regularized lower incomplete gamma function from 1.
References
[1] Olver, F. W. J., A. B. Olde Daalhuis, D. W. Lozier, B. I. Schneider, R. F. Boisvert, C. W. Clark, B. R. Miller, and B. V. Saunders, eds., Chapter 8. Incomplete Gamma and Related Functions, NIST Digital Library of Mathematical Functions, Release 1.0.22, Mar. 15, 2018.
Extended Capabilities
Version History
Introduced before R2006a
See Also
gamma | gammaincinv | gammaln | psi