lines
Lines colormap array

Syntax
Description
c = lines returns the lines colormap as a three-column array with the
same number of rows as the colormap for the current figure (gcf). If no figure exists, then the
array contains 256 rows. Each row in the array contains the red, green, and blue
intensities for a specific color. The intensities are in the range [0,1], and the
color scheme matches the default ColorOrder property of the
Axes. Thus, you can use this colormap to make
your chart colors match the output of the plot function.
![]()
Examples
Create a scatter plot using the default colors.
x = [3.5 3.3 5 6.1 4 2];
y = [14 5.7 12 6 8 9];
sz = 100*[6 100 20 3 15 20];
c = [1 2 3 4 5 6];
scatter(x,y,sz,c,'filled','MarkerEdgeColor','k','MarkerFaceAlpha',.7);
xlim([1 7]);
ylim([1 16]);
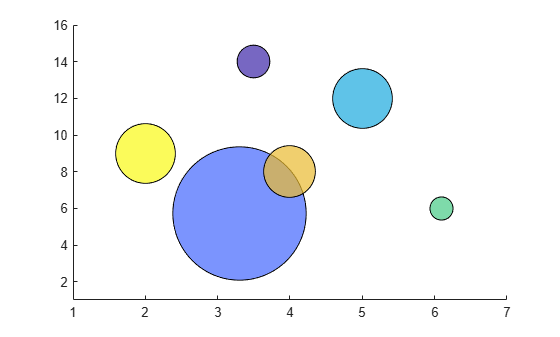
Get the lines colormap array with six entries. Then replace the colormap in the scatter plot.
c = lines(6);
colormap(c);
