Hyperlink
Description
A hyperlink UI component displays a clickable link that can open a webpage from
an app. Use the Hyperlink object to modify the appearance and behavior of a
hyperlink after you create it.
Creation
Create a hyperlink in an app using the uihyperlink
function.
Properties
Hyperlink
Hyperlink display text, specified as a character vector, cell array of character vectors, string scalar, string array, or 1-D categorical array. Use a cell array of character vectors or a string array to specify multiple lines of text.
Example: 'Click here'
Example: {'Click' 'Here'}
Horizontal alignment of the text, specified as:
'right'— Text aligns on the right side of the area specified by thePositionproperty.'left'— Text aligns on the left side of the area specified by thePositionproperty.'center'— Text centers horizontally in the area specified by thePositionproperty.
Aligning hyperlink text is useful when the text spans multiple lines.
Vertical alignment of the text, specified as one of the following:
'center'— Text centers vertically in the area specified by thePositionproperty.'top'— Text aligns on the top of the area specified by thePositionproperty.'bottom'— Text aligns on the bottom of the area specified by thePositionproperty.
Aligning hyperlink text is useful when the text spans multiple lines.
Word wrapping to fit component width, specified as 'off' or 'on', or as numeric or logical 0 (false) or 1 (true). A value of 'off' is equivalent to false, and 'on' is equivalent to true. Thus, you can use the value of this property as a logical value. The value is stored as an on/off logical value of type matlab.lang.OnOffSwitchState.
Use this property to prevent text from getting clipped horizontally when the width of the component is smaller than the text you want to display.
'off'— Text does not wrap.'on'— Breaks text into new lines so that each line fits within the width of the component and avoids breaking words when possible.
Setting the WordWrap property to 'on' does not
prevent text from getting clipped vertically when the height of the component is too
small to display all the lines of text.
Font and Color
Font color, specified as an RGB triplet, a hexadecimal color code, or one of the options listed in the table.
RGB triplets and hexadecimal color codes are useful for specifying custom colors.
An RGB triplet is a three-element row vector whose elements specify the intensities of the red, green, and blue components of the color. The intensities must be in the range
[0,1]; for example,[0.4 0.6 0.7].A hexadecimal color code is a character vector or a string scalar that starts with a hash symbol (
#) followed by three or six hexadecimal digits, which can range from0toF. The values are not case sensitive. Thus, the color codes"#FF8800","#ff8800","#F80", and"#f80"are equivalent.
Alternatively, you can specify some common colors by name. This table lists the named color options, the equivalent RGB triplets, and hexadecimal color codes.
| Color Name | Short Name | RGB Triplet | Hexadecimal Color Code | Appearance |
|---|---|---|---|---|
"red" | "r" | [1 0 0] | "#FF0000" |
|
"green" | "g" | [0 1 0] | "#00FF00" |
|
"blue" | "b" | [0 0 1] | "#0000FF" |
|
"cyan"
| "c" | [0 1 1] | "#00FFFF" |
|
"magenta" | "m" | [1 0 1] | "#FF00FF" |
|
"yellow" | "y" | [1 1 0] | "#FFFF00" |
|
"black" | "k" | [0 0 0] | "#000000" |
|
"white" | "w" | [1 1 1] | "#FFFFFF" |
|
This table lists the default color palettes for plots in the light and dark themes.
| Palette | Palette Colors |
|---|---|
Before R2025a: Most plots use these colors by default. |
|
|
|
You can get the RGB triplets and hexadecimal color codes for these palettes using the orderedcolors and rgb2hex functions. For example, get the RGB triplets for the "gem" palette and convert them to hexadecimal color codes.
RGB = orderedcolors("gem");
H = rgb2hex(RGB);
Before R2023b: Get the RGB triplets using RGB =
get(groot,"FactoryAxesColorOrder").
Before R2024a: Get the hexadecimal color codes using H =
compose("#%02X%02X%02X",round(RGB*255)).
Font color after click, specified as an RGB triplet, a hexadecimal color code, or one of the color options listed in the table. The default color is purple.
For a custom color, specify an RGB triplet or a hexadecimal color code.
An RGB triplet is a three-element row vector whose elements specify the intensities of the red, green, and blue components of the color. The intensities must be in the range
[0,1], for example,[0.4 0.6 0.7].A hexadecimal color code is a string scalar or character vector that starts with a hash symbol (
#) followed by three or six hexadecimal digits, which can range from0toF. The values are not case sensitive. Therefore, the color codes"#FF8800","#ff8800","#F80", and"#f80"are equivalent.
Alternatively, you can specify some common colors by name. This table lists the named color options, the equivalent RGB triplets, and the hexadecimal color codes.
| Color Name | Short Name | RGB Triplet | Hexadecimal Color Code | Appearance |
|---|---|---|---|---|
"red" | "r" | [1 0 0] | "#FF0000" |
|
"green" | "g" | [0 1 0] | "#00FF00" |
|
"blue" | "b" | [0 0 1] | "#0000FF" |
|
"cyan"
| "c" | [0 1 1] | "#00FFFF" |
|
"magenta" | "m" | [1 0 1] | "#FF00FF" |
|
"yellow" | "y" | [1 1 0] | "#FFFF00" |
|
"black" | "k" | [0 0 0] | "#000000" |
|
"white" | "w" | [1 1 1] | "#FFFFFF" |
|
"none" | Not applicable | Not applicable | Not applicable | No color |
This table lists the default color palettes for plots in the light and dark themes.
| Palette | Palette Colors |
|---|---|
Before R2025a: Most plots use these colors by default. |
|
|
|
You can get the RGB triplets and hexadecimal color codes for these palettes using the orderedcolors and rgb2hex functions. For example, get the RGB triplets for the "gem" palette and convert them to hexadecimal color codes.
RGB = orderedcolors("gem");
H = rgb2hex(RGB);
Before R2023b: Get the RGB triplets using RGB =
get(groot,"FactoryAxesColorOrder").
Before R2024a: Get the hexadecimal color codes using H =
compose("#%02X%02X%02X",round(RGB*255)).
Background color, specified as an RGB triplet, a hexadecimal color code, or one of the color options listed in the table.
For a custom color, specify an RGB triplet or a hexadecimal color code.
An RGB triplet is a three-element row vector whose elements specify the intensities of the red, green, and blue components of the color. The intensities must be in the range
[0,1], for example,[0.4 0.6 0.7].A hexadecimal color code is a string scalar or character vector that starts with a hash symbol (
#) followed by three or six hexadecimal digits, which can range from0toF. The values are not case sensitive. Therefore, the color codes"#FF8800","#ff8800","#F80", and"#f80"are equivalent.
Alternatively, you can specify some common colors by name. This table lists the named color options, the equivalent RGB triplets, and the hexadecimal color codes.
| Color Name | Short Name | RGB Triplet | Hexadecimal Color Code | Appearance |
|---|---|---|---|---|
"red" | "r" | [1 0 0] | "#FF0000" |
|
"green" | "g" | [0 1 0] | "#00FF00" |
|
"blue" | "b" | [0 0 1] | "#0000FF" |
|
"cyan"
| "c" | [0 1 1] | "#00FFFF" |
|
"magenta" | "m" | [1 0 1] | "#FF00FF" |
|
"yellow" | "y" | [1 1 0] | "#FFFF00" |
|
"black" | "k" | [0 0 0] | "#000000" |
|
"white" | "w" | [1 1 1] | "#FFFFFF" |
|
"none" | Not applicable | Not applicable | Not applicable | No color |
This table lists the default color palettes for plots in the light and dark themes.
| Palette | Palette Colors |
|---|---|
Before R2025a: Most plots use these colors by default. |
|
|
|
You can get the RGB triplets and hexadecimal color codes for these palettes using the orderedcolors and rgb2hex functions. For example, get the RGB triplets for the "gem" palette and convert them to hexadecimal color codes.
RGB = orderedcolors("gem");
H = rgb2hex(RGB);
Before R2023b: Get the RGB triplets using RGB =
get(groot,"FactoryAxesColorOrder").
Before R2024a: Get the hexadecimal color codes using H =
compose("#%02X%02X%02X",round(RGB*255)).
Data Types: double | char
Interactivity
Hyperlink URL, specified as a character vector or string scalar. When the hyperlink is clicked, the web address opens in a new browser tab. If the user is running the app in a browser via MATLAB Online™ or as a web app, the new tab opens in the current browser. Otherwise, the new tab opens in the default browser on the user's system.
Visual appearance of the hyperlink, specified as 'on' or
'off', or as numeric or logical 1
(true) or 0 (false). A
value of 'on' is equivalent to true, and
'off' is equivalent to false. Thus, you can
use the value of this property as a logical value. The value is stored as an on/off
logical value of type matlab.lang.OnOffSwitchState.
'on'— Hyperlink appears normal
'off'— Hyperlink appears dimmed
Tooltip, specified as a character vector, cell array of character vectors, string array, or 1-D categorical array. Use this property to display a message when the user hovers the pointer over the link at run time. The tooltip displays even when the link is disabled. To display multiple lines of text, specify a cell array of character vectors or a string array. Each element in the array becomes a separate line of text. If you specify this property as a categorical array, MATLAB uses the values in the array, not the full set of categories.
When Tooltip is set to '' and the app user
hovers over the link, the component displays a message with the value of
URL.
Context menu, specified as a ContextMenu object created using the uicontextmenu function. Use this property to display a context menu when
you right-click on a component.
Position
Hyperlink location and size, relative to the parent, specified as the vector [left bottom width height]. This table describes each element in the vector.
| Element | Description |
|---|---|
left | Distance from the inner left edge of the parent container to the outer left edge of the label |
bottom | Distance from the inner bottom edge of the parent container to the outer bottom edge of the label |
width | Distance between the right and left outer edges of the label |
height | Distance between the top and bottom outer edges of the label |
The Position values are relative to the drawable area of the parent container. The drawable area is the area inside the borders of the container and does not include the area occupied by decorations such as a menu bar or title.
All measurements are in pixel units.
Example: [100 100 100 20]
Inner location and size of hyperlink, specified as [left bottom width
height]. Position values are relative to the parent container. All
measurements are in pixel units. This property value is identical to
Position property.
This property is read-only.
Outer location and size of hyperlink, returned as [left bottom width
height]. Position values are relative to the parent container. All
measurements are in pixel units. This property value is identical to
Position.
Layout options, specified as a
GridLayoutOptions object. This property specifies options for
components that are children of grid layout containers. If the component is not a
child of a grid layout container (for example, it is a child of a figure or panel),
then this property is empty and has no effect. However, if the component is a child of
a grid layout container, you can place the component in the desired row and column of
the grid by setting the Row and Column
properties on the GridLayoutOptions object.
For example, this code places a hyperlink in the third row and second column of its parent grid.
g = uigridlayout([4 3]);
hlink = uihyperlink(g);
hlink.Layout.Row = 3;
hlink.Layout.Column = 2;
To make the hyperlink span multiple rows or columns, specify the
Row or Column property as a two-element
vector. For example, this hyperlink spans columns 2 through
3:
hlink.Layout.Column = [2 3];
Callbacks
Hyperlink clicked callback, specified as one of these values:
A function handle.
A cell array in which the first element is a function handle. Subsequent elements in the cell array are the arguments to pass to the callback function.
A character vector containing a valid MATLAB expression (not recommended). MATLAB evaluates this expression in the base workspace.
This callback executes after the URL opens when the user clicks the hyperlink.
This callback function can access specific information about the user's interaction with the hyperlink. MATLAB passes this information in a HyperlinkClickedData object as the second argument to your callback function. In App Designer, the argument is called event. You can query the object properties using dot notation. For example, event.Source returns the Hyperlink object. The HyperlinkClickedData is not available to callback functions specified as character vectors.
The following table lists the properties of the HyperlinkClickedData object.
| Property | Value |
|---|---|
EventName | 'HyperlinkClicked' |
Source | Component that executes the callback |
For more information about writing callbacks, see Callbacks in App Designer.
Callback Execution Control
Parent/Child
Parent container, specified as a Figure object or
one of its child containers: Tab, Panel, ButtonGroup, or
GridLayout. If no container is specified,
MATLAB calls the uifigure function to create a new Figure object that serves as the parent container.
Identifiers
This property is read-only.
Type of graphics object, returned as 'uihyperlink'.
Examples
Create a default hyperlink component.
fig = uifigure;
hlink = uihyperlink(fig);
Change the URL to link to the MathWorks® home page. Add a tooltip that shows the URL when the app user hovers their pointer over the hyperlink.
hlink.URL = "https://www.mathworks.com";
hlink.Tooltip = hlink.URL;
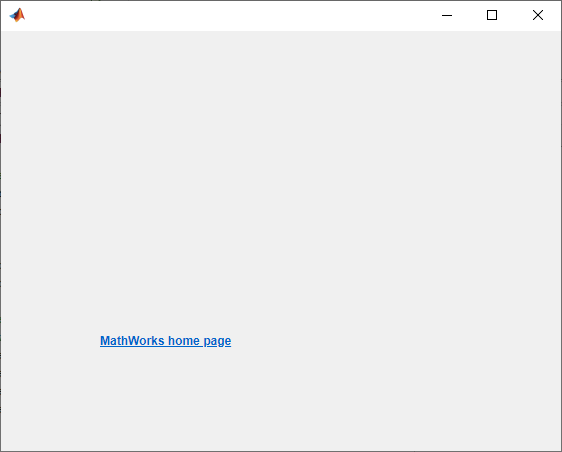
Create a default hyperlink.
fig = uifigure;
hlink = uihyperlink(fig);
Change the link text and URL.
hlink.Text = "MathWorks home page";
hlink.URL = "https://www.mathworks.com/"

The link text is clipped because the current size is too small for the new text.
Determine the current link size by getting the third and fourth elements of the
Position property value.
size = hlink.Position(3:4)
size =

    70    22
Change the size to accommodate the new text.
hlink.Position(3:4) = [150 22];
To make a link open a file on the app user's system when clicked, use
the file:/// URL scheme.
Create a hyperlink component. Open an HTML file named myfile.html
when an app user clicks the hyperlink by setting the URL property.
Specify the URL by using the file:/// URL scheme followed by the file
location and name.
fig = uifigure;
hlink = uihyperlink(fig);
file = fullfile(pwd,"myfile.html")
hlink.URL = "file:///" + file;
To make a link send an email when clicked, use the
mailto: URL scheme.
Create a default hyperlink component.
fig = uifigure;
hlink = uihyperlink(fig);
To run this example, replace the value for email with a valid
email address.
email = 'myaddress@provider.ext';
hlink.URL = ['mailto:' email];
When the app user clicks on the link, the default mail client opens a new email with
the destination field pre-populated with email.
Create a hyperlink with a custom effect: it creates a plot as well as
opening a URL when the app user clicks it. To do this, create a set of UI axes and a
HyperlinkClickedFcn callback that creates a plot in these
axes.
Create a file named hyperlinkPlot.m on your MATLAB path that contains the following code. This code creates a window
containing a hyperlink and a set of UI axes. When the app user clicks the link, first
the app user's browser loads the MATLAB product page, then the HyperlinkClickedFcn callback
plots some data.
function hyperlinkPlot
% Create a figure window and UI axes
fig = uifigure;
ax = uiaxes(fig);

% Create a hyperlink
hlink = uihyperlink(fig,...
    "Position",[200 350 70 22], ...
    "Text","MATLAB", ...
    "URL","https://www.mathworks.com/products/matlab.html", ...
    "HyperlinkClickedFcn",@(hlink,event) plotHyperlinkClicked(hlink,ax));
end

% Create the function for the HyperlinkClickedFcn callback
function plotHyperlinkClicked(hlink,ax)
    L = 160*membrane(1,100);
    s = surf(ax,L);
    s.EdgeColor = 'none';
end
Run hyperlinkPlot, then click the link. MATLAB opens the URL, then plots the data.
