uitree
Create tree or check box tree component
Syntax
Description
t = uitreeTree object.
MATLAB® calls the uifigure function to create the
figure.
t = uitree(style)style as
'checkbox' to create a check box tree instead of a standard
one.
t = uitree(parent)Figure object or one of its child
containers.
t = uitree(___,Name,Value)Name,Value arguments. Use this option with any of the input
argument combinations in the previous syntaxes.
Examples
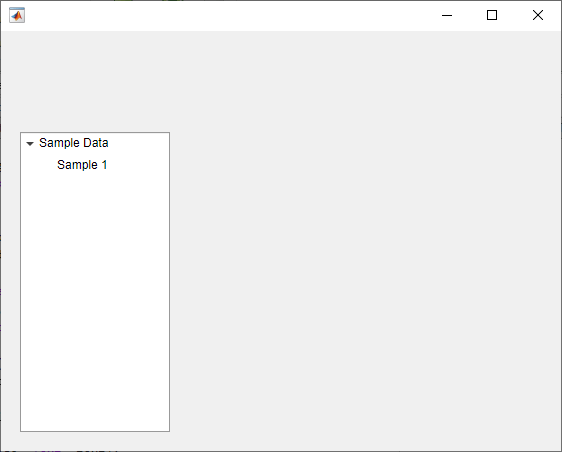
Create a tree that contains a parent node called Sample
Data with a child node called Sample 1.
Expand the tree to see both nodes.
fig = uifigure; t = uitree(fig); parent = uitreenode(t,'Text','Sample Data'); child = uitreenode(parent,'Text','Sample 1'); expand(t)
Create a check box tree that contains a parent node called
Sample
                            Data
with a child node called
Sample 1. Expand the tree to see both nodes.
fig = uifigure;
t = uitree(fig,'checkbox');
parent = uitreenode(t,'Text','Sample Data');
child = uitreenode(parent,'Text','Sample 1');
expand(t)

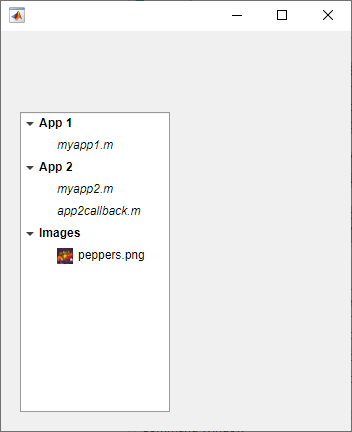
Style nodes in a tree that showcases a file structure to visually distinguish different file types.
Create a tree UI component. Each top-level node represents a folder. Each child node represents a file in that folder. Expand the tree to see all the nodes.
fig = uifigure("Position",[300 300 350 400]);
t = uitree(fig);

% Parent nodes
n1 = uitreenode(t,"Text","App 1");
n2 = uitreenode(t,"Text","App 2");
n3 = uitreenode(t,"Text","Images");

% Child nodes
n11 = uitreenode(n1,"Text","myapp1.m");
n21 = uitreenode(n2,"Text","myapp2.m");
n22 = uitreenode(n2,"Text","app2callback.m");
n31 = uitreenode(n3,"Text","peppers.png");

expand(t)

Create three styles: one with a bold font weight, one with an italic font angle, and one with an icon.
dirStyle = uistyle("FontWeight","bold");
mStyle = uistyle("FontAngle","italic");
imgStyle = uistyle("Icon","peppers.png");
Apply the bold style to the top-level nodes to distinguish the nodes that
represent folders. Apply the italic style to the children of the App
1 and App 2 nodes to distinguish the nodes that
represent MATLAB program files. Finally, apply the icon style to the node that
represents an image file to show a preview of the image.
addStyle(t,dirStyle,"level",1)
addStyle(t,mStyle,"node",[n1.Children;n2.Children])
addStyle(t,imgStyle,"node",n31)
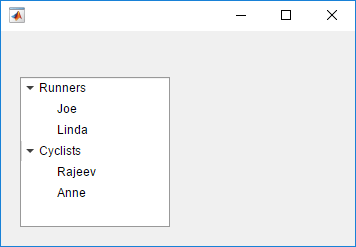
Create an app that displays athlete names grouped by sport. When the app user clicks on a name, MATLAB displays data about the athlete.
Create a program file called mytreeapp.m that contains the following commands to create a tree, a set of nested tree nodes, and a callback function for the tree. The SelectionChangedFcn property specifies the function to execute when the user clicks a node in the tree.
function mytreeapp
    fig = uifigure;
    t = uitree(fig,"Position",[20 20 150 150]);

    % Assign callback in response to node selection
    t.SelectionChangedFcn = @nodechange;

    % First level nodes
    category1 = uitreenode(t,"Text","Runners","NodeData",[]);
    category2 = uitreenode(t,"Text","Cyclists","NodeData",[]);

    % Second level nodes.
    % Node data is age (y), height (m), weight (kg)
    p1 = uitreenode(category1,"Text","Joe","NodeData",[40 1.67 58] );
    p2 = uitreenode(category1,"Text","Linda","NodeData",[49 1.83 90]);
    p3 = uitreenode(category2,"Text","Rajeev","NodeData",[25 1.47 53]);
    p4 = uitreenode(category2,"Text","Anne","NodeData",[88 1.92 100]);

    % Expand the tree
    expand(t);

    % Create the function for the SelectionChangedFcn callback
    % When the function is executed, it displays the data of the selected item
    function nodechange(src,event)
        node = event.SelectedNodes;
        display(node.NodeData);
    end
end
When the user runs mytreeapp and clicks a node in the tree, MATLAB displays the NodeData for that node.
Create an app that displays a grocery list grouped by food category. The app user can check individual items or entire food categories, and MATLAB displays the total weight of the checked items.
Create a program file called mycheckboxtreeapp.m that
contains the following commands to create a check box tree, a set of nested
tree nodes, and two callback functions for the check box tree. The
CheckedNodesChangedFcn property specifies the
function to execute when the user checks or clears a node in the tree. The
SelectedNodesChangedFcn property specifies the
function to execute when the user selects a node in the tree.
function mycheckboxtreeapp
    fig = uifigure;
    cbt = uitree(fig,'checkbox','Position',[20 20 150 150]);

    % Assign callbacks in response to node check and selection
    cbt.CheckedNodesChangedFcn = @checkchange;
    cbt.SelectionChangedFcn = @selectchange;

    % First level nodes
    category1 = uitreenode(cbt,'Text','Vegetables','NodeData',[]);
    category2 = uitreenode(cbt,'Text','Fruits','NodeData',[]);

    % Second level nodes.
    % Node data is the weight of the food item (in grams)
    p1 = uitreenode(category1,'Text','Cucumber','NodeData',400);
    p2 = uitreenode(category1,'Text','Carrot','NodeData',65);
    p3 = uitreenode(category2,'Text','Apple','NodeData',183);
    p4 = uitreenode(category2,'Text','Banana','NodeData',120);

    % Expand the tree
    expand(cbt);

    % Create the function for the CheckedNodesChangedFcn callback
    % When this function is executed, it displays the total weight
    % of all checked items
    function checkchange(src,event)
        nodes = event.LeafCheckedNodes;
        if ~isempty(nodes)
            data = [nodes.NodeData];
            display(sum(data));
        end
    end

    % Create the function for the SelectedNodesChangedFcn callback
    % When this function is executed, it displays the name
    % of the selected item
    function selectchange(src,event)
        node = event.SelectedNodes;
        display(node.Text);
    end
end
When the user runs mycheckboxtreeapp and checks or
clears a node in the tree, MATLAB displays the sum of the weights (stored in
NodeData) for all the second-level checked nodes.
When the user selects a node in the tree, MATLAB displays the text of that node.

Create a tree that populates nodes based on the data in a table.
Create a figure with a grid layout manager to hold the UI components. Load sample data on electric utility outages and create a table UI component to display the data. Then, create a tree to hold nodes listing the regions and causes of the outages.
fig = uifigure;
gl = uigridlayout(fig,[1 2]);
gl.ColumnWidth = {'2x','1x'};

T = readtable("outages.csv");
T = T(1:20,["Region","OutageTime","Loss","Cause"]);
tbl = uitable(gl,"Data",T);

tr = uitree(gl);
Specify the table variables to display in the tree. For each of those variables, create
a top-level node whose text is the variable name. Extract the relevant data by converting
the table entries for the variable to a categorical array and returning the list of
categories as names. Then, loop through the categories. For each element,
add a node to the tree under the appropriate parent node.
vars = ["Region","Cause"];

for k1 = 1:length(vars)
    var = vars{k1};
    varnode = uitreenode(tr,"Text",var);
    rows = T{:,var};
    names = categories(categorical(rows));

    for k2 = 1:length(names)
        text = names{k2};
        uitreenode(varnode,"Text",text);
    end
end
Expand the tree to see all the nodes.
expand(tr)

Input Arguments
Name-Value Arguments
More About
In a standard tree or a check box tree, a selected node is indicated by a blue highlight around the node text. The app user can select a node by clicking on the node text.
In a standard tree with the Multiselect property set to
'off' and in every check box tree, at most one node can be
selected at any time. In a standard tree, you can set the
Multiselect property to 'on' to allow for
multiple nodes to be selected.
In this image, the Carrot node is selected.
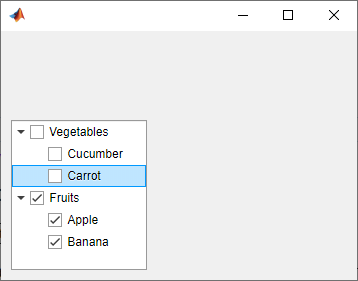
In a check box tree, a checked node is indicated by a checked check box to the left of the node text. Any number of nodes can be checked. The app user can check or clear a node by clicking on the check box. In a standard tree, you cannot check nodes.
In this image, the Fruits, Apple, and
Banana nodes are checked.