Monitor Learner Progress with Learner Analytics
Learner Analytics provide a way to assess learner progress using visual graphs.
To view these graphs, go to any assessment item and then click Reports.
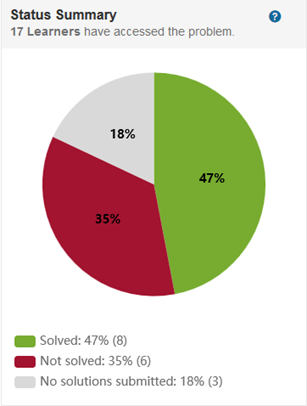
Status Summary
The status summary graph uses a pie chart to show the percentages of learners who have:
Solved the assessment item.
Not solved the assessment item but have made at least one submission.
Not made any submissions but have accessed the assessment item. The learner may have simply read the assessment item, or they may have run their solution or pretests. However, the learner has not yet submitted a solution.
The percentages represent learners who have accessed the assessment item in some way. For example, if 150 learners are in a class and 100 have accessed the assessment item, the percentages reflect the actions of those 100 learners only.
The following image shows an example status summary graph. In it, you can see that 17 learners have looked at or worked on the assessment item. From that 17, 47 percent (8 learners) solved the assessment item, 35 percent (6 learners) did not, and no solutions were submitted by 18 percent (3 learners).
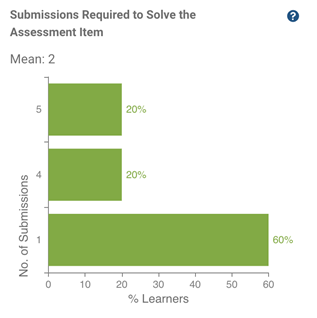
Submissions Required to Solve the Assessment Item
The submissions required graph use a horizontal bar chart to show the number of submissions learners needed to solve the assessment item.
Key points:
The graphs represent only learners who have solved the assessment item.
The percentages represent the number of submissions it took per learner to submit a solution that solves the assessment item. The first solution that solves the assessment item is counted. For example, if a learner solves the assessment item in their third submission, then three submissions for that learner are counted, even if the learner continues to submit additional solutions, correct or not.
If the scoring method is weighted, the assessment item is considered solved only when the learner’s score is 100%.
The following image shows an example submissions required graph. In it, you can see that the mean is 2, 13 percent of learners needed 5 submissions, 13 percent needed 3 submissions, 25 percent needed 2 submissions, and 50 percent needed 1 submission.
Average Submissions Required to Pass Each Test
The average submissions graph uses a vertical bar chart to show the average number of submissions required for learners for their solutions to pass each assessment test.
Key points:
The graph represents only learners who have solved the assessment item.
The average attempts for each assessment test reflect when a learner's solution permanently passes the conditions in an assessment test. For example, the learner's solution passes for the first time on the second submission, fails on the third and fourth submissions, and then passes again on the fifth submission. If the learner's solution continues to pass the assessment test in subsequent submissions, MATLAB® Grader™ records five as the number of times the solution required to pass.
The following image shows an example of an average submissions graph. In it, you can see that learners required an average of 1.5 attempts to pass Test 1, and learners required an average of 1.88 attempts to pass Test 2.

For descriptions of each assessment test and distribution details, click on the test bar.
Submissions Made Attempting to Solve the Assessment Item
The submissions made graph uses a horizontal bar chart to show the number of submissions learners have made attempting to solve the assessment item, by percentage of learners.
Key points:
The percentages are of learners who have not yet solved the assessment item but have made at least one submission.
If the scoring method is weighted, the assessment item is considered solved only when the learner’s score is 100%.
The following image shows an example submissions made graph. In it, you can see that the mean is 1, 17% of learners made 2 submissions, and 83% of learners made 1 submission.

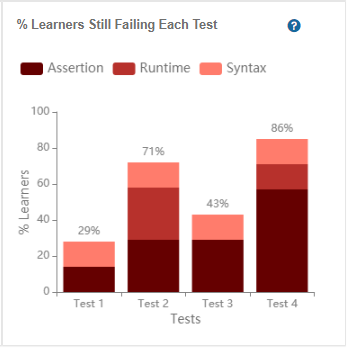
Learners Still Failing Each Test
The learners still failing graph uses a vertical bar chart to show the percentage of learner solutions still failing each assessment test.
Key points:
The percentages are of learners who have not yet solved the assessment item but have made at least one submission.
The graph reflects each learner’s most recent submission. For example, if a learner's solution passed Test 2 in a previous submission but failed in their most recent submission, the graph shows the learner as failing Test 2.
The graph distinguishes between the following types of errors:
Assertion–The assessment test condition failed. For example, if an assessment test checks whether variable x equals the reference solution, but it does not, the solution fails.
Runtime–An error condition occurred when executing the code, requiring execution to stop. Possibilities include calling a MATLAB function with incorrect input parameters, negative indexing of a vector variable, or assigning an undefined function or variable. For script-based assessment items, runtime errors result in the solution failing all assessment tests.
Syntax–The code contains a syntax error. For both script-based and function-based assessment items, syntax errors result in the solution failing all assessment tests.
The following image shows an example of a learners still failing graph. In it, you can see bars for four assessment tests, each of which learners are still failing with a various assortment of possible errors.