All Optimization Results
You can select from these views on the left-hand side (LHS) of the Optimization Output view under All Optimization Results:
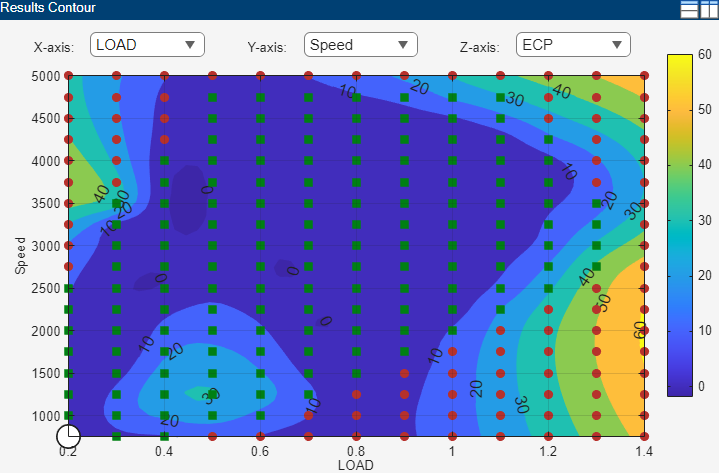
Results Contour — Shows a contour plot of one solution at all operating points and all runs in the problem.
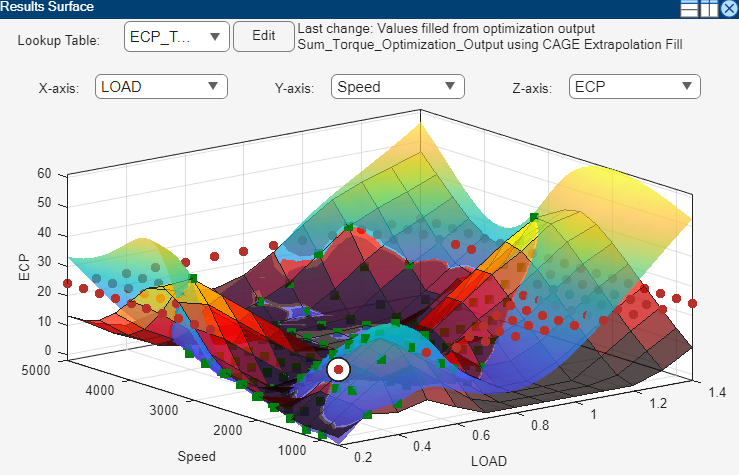
Results Surface — Shows a 3D plot of one solution at all operating points and all runs in the problem.
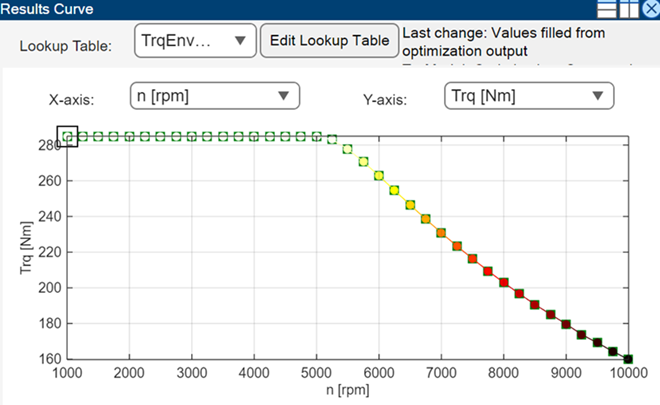
Results Curve — Shows a 2D plot of one solution at all operating points and all runs in the problem when the optimization has only one fixed variable.
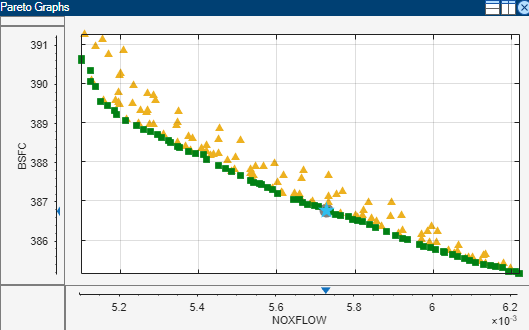
Pareto Graphs — Shows the available solutions for the selected run. Use for multiobjective optimization results, when there is more than one solution for a run.
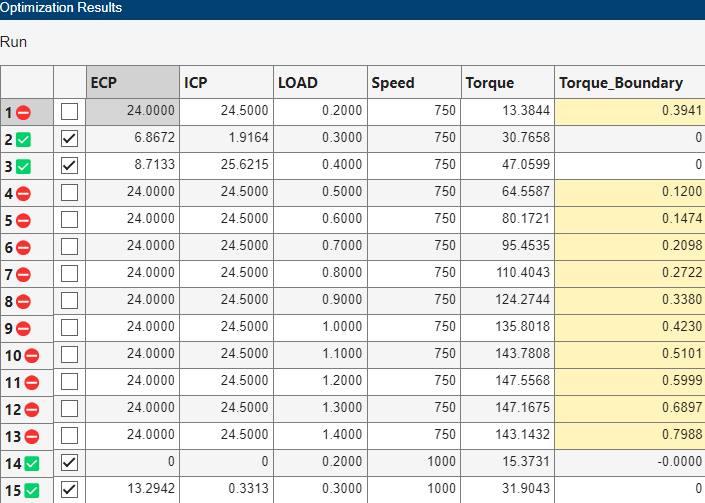
Optimization Results Table — Displays a table with one solution at all operating points and all runs.
The default view of tables and graphs is dependent on the optimization type.
Results Contour
To display the Results Contour view, right-click the view and select Current View > Results Contour. Use the axes pop-up controls to change what is plotted on each axis. You can plot these against each other:
Fixed variables
Optimization variables
Evaluation of objectives at the optimization variables
The optimization results are plotted as points, and extrapolation contours of the z-axis quantity as a function of the x and y-axis quantities are also displayed.
Each optimization result is displayed using the Accept icon, as shown in the Optimization Results table:
 Successful result
 Failed result
 Incomplete result
 Selected
 Currently selected result (black
outline). To select results, click an icon in the plot or a value in the
table. Changing the selected result in the Results
Contour view automatically updates the selection in the table
and updates any plots in the lower half of the output view.
Currently selected result (black
outline). To select results, click an icon in the plot or a value in the
table. Changing the selected result in the Results
Contour view automatically updates the selection in the table
and updates any plots in the lower half of the output view.
Rotation is not permitted in the contour view.
Use the right-click context menu to control these options.
Results to Display |
|
Set Acceptable | Mark an optimization result as acceptable if it is marked as unacceptable. Any results whose acceptability has been changed are shown as stars in the plot. |
Set Unacceptable | Mark an optimization result as unacceptable. |
Extrapolate All | Toggles extrapolation from acceptable solutions only (default) to using all results for extrapolation. |
Contour Options |
|
Results Surface
To display the Results Surfaceview, right-click the view and select Current View > Results Surface. Use the axes pop-up controls to change what is plotted on each axis.
Fixed variables
Optimization variables
Evaluation of objectives at the optimization variables
The lookup tables are overlaid using a hot (red) colormap, and an extrapolation surface of the z-axis quantity as a function of the x and y-axis quantities is also displayed. The accept icon for each result is plotted on the Results Surface, where acceptable solutions are used to fit the surface displayed in the plot.
Left-click anywhere except an icon to rotate the plot.
The right-click context menu shares these options with the Results Contour view:
Results to Display
Set Acceptable
Unacceptable
Extrapolate All
Some additional items for the surface view include:
Hide Surface — Toggle whether the surface is visible or not.
Results Curve
To display the Results Curveview, right-click the view and select Current View > Results Curve. Use the axes pop-up controls to change what is plotted on each axis.
The right-click context menu shares these options with the Results Contour view:
Results to Display
Set Acceptable
Unacceptable
Extrapolate All
Some additional items for the surface view include:
Hide Line — Toggle whether the line is visible or not.
Pareto Graphs
To display the Pareto Graphs view for a multiobjective or modal optimization, right-click the view and select Current View > Pareto Graphs. For more information, see Pareto Graphs.
Optimization Results Table
The Optimization Results table displays the selected solution at all operating points. CAGE automatically selects successful optimization solutions and highlights unsuccessful solutions for you to investigate. CAGE indicates the selections in the icons and check boxes next to the Run column.
For optimizations with more than one solution per run, such as multiobjective and modal, the table displays controls to scroll through solutions using arrows or the edit box.