Resolve Error: Client Lost Connection to Worker
Issue
When you run a parfor-loop, parfeval computation, or spmd block on an interactive
parallel pool, the pool might shut down with an error message like the following:
This parallel pool has been shut down.
Caused by: The client lost connection to worker 3 (Task 3; Host: localhost), potentially due to
network issues or errors during the interactive communicating job.
If you are running a parfor-loop, the error message is often
preceded by warning messages like the
following:
Warning: A worker aborted during execution of the parfor loop. The parfor loop will
 now run again on the remaining workers.
If you are running an spmd block, the
spmd block might also error with a message like the
following:
The parallel pool that SPMD was using has been shut down. Reason:
The client lost connection to worker 3 (Task 3; Host: localhost), potentially due to network
issues or errors during the interactive communicating job.
Possible Solutions
MATLAB® might shut down the parallel pool if a MATLAB worker terminates unexpectedly or if network, memory, or communication issues prevent the worker from connecting to the client.
Check for MATLAB Worker Crash
If the error was caused by a worker terminating unexpectedly, the worker
generates crash logs just like the MATLAB client. Use one of these approaches to obtain the crash logs
generated by the workers. When you have the crash logs, examine the logs to
troubleshoot the cause of the crash. If the crash was in MEX code you wrote,
then you can try to run the MEX code on the client to check for issues.
Otherwise, for assistance with understanding and troubleshooting your crash,
submit a support case at https://www.mathworks.com/support/contact_us.html.
Local Machine Processes Pools. The MATLAB client displays a warning after the error with a link to the location of the crash logs. To access the crash logs, select the link.
Warning: 6 worker(s) crashed while executing code in the current parallel pool. MATLAB may
attempt to run the code again on the remaining workers of the pool, unless an spmd block has
run. View the crash dump files to determine what caused the workers to crash.
You can also access the crash logs in the job storage location of the local machine. To locate the job storage location, type these commands in the MATLAB Command Window.
c = parcluster("Processes");
c.JobStorageLocationJob# folder with the job ID of the failed
parallel pool job and access any matlab_crash_dump files.
Use one of these methods to identify the job ID of the failed parallel pool
job on the client.
In the Job Monitor, locate the job ID of jobs with the description "Interactive pool", and the state "failed".
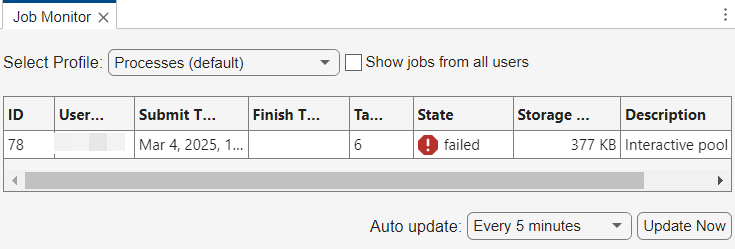
When you next create a parallel pool with the
Processesprofile, the client displays a message with the job ID for the failed parallel pool.Preserving jobs with IDs: 78 because they contain crash dump files. You can use 'delete(myCluster.Jobs)' to remove all jobs created with profile Processes. To create 'myCluster' use 'myCluster = parcluster('Processes')'.
MATLAB Job Scheduler Cluster Pools. The crash logs are on the compute node hosting the lost worker. Where possible, the MATLAB client displays a warning after the error with a link to the location of the crash logs. To access the location of the crash logs, select the link.
Warning: 12 worker(s) crashed while executing code in the current parallel pool. MATLAB may
attempt to run the code again on the remaining workers of the pool, unless an spmd block has
run. View the crash dump files to determine what caused the workers to crash.LOGBASE parameter in the mjs_def
file. For more information, see Locate Log Files (MATLAB Parallel Server).Third-Party Scheduler Cluster Pools. You can find the crash logs by accessing the job storage location of the
cluster object. To locate the job storage location, type these commands in
the MATLAB Command Window, replacing
MyThirdPartyScheduler with the name of the cluster
profile for your third-party scheduler
cluster.
c = parcluster("MyThirdPartyScheduler");
c.JobStorageLocationJob# folder with the job ID of the failed parallel
pool job and access any Job#.log and
matlab_crash_dump files. Use one of these methods to
identify the job ID of the failed parallel pool job on the client.
In the Job Monitor, locate the job ID of jobs with the description "Interactive pool", and the state "failed".
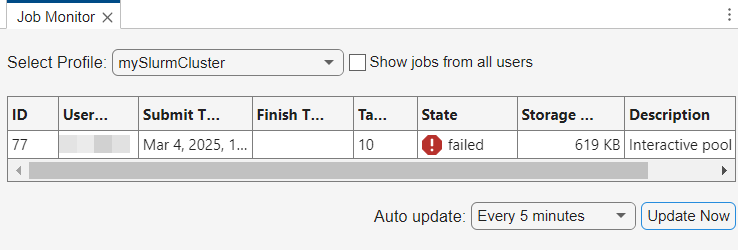
When you next create a parallel pool with the same cluster profile, the client displays a message with the job ID for the failed parallel pool.
Starting parallel pool (parpool) using the 'mySlurmCluster' profile ...
Preserving jobs with IDs: 77 because they contain crash dump files.
You can use 'delete(myCluster.Jobs)' to remove all jobs created with profile mySlurmCluster.
To create 'myCluster' use 'myCluster = parcluster('mySlurmCluster')'.
Check for Other Issues
If you do not find crash logs for the failed parallel pool, then the cause is likely related to network, memory, or communication issues.
Investigate Memory Issues. On cluster nodes with Linux® operating systems, the operating system might terminate a worker process if it uses too much memory. This can occur if your code operates on unexpectedly large amounts of data or does not use memory efficiently. You can prototype your code on the MATLAB client to investigate memory issues.
Measure how much data is transferred to and from the workers in a parallel pool using the Pool Dashboard or the
ticBytesandtocBytesfunctions on a scaled down version of your parallel code.To see how much temporary data the workers create, switch to serial execution and monitor your system's memory usage. Use the
whosfunction on temporary variables to help identify large variables in memory.
To learn how to use memory efficiently in MATLAB, see Strategies for Efficient Use of Memory. For more information about troubleshooting out of memory errors, see Resolve “Out of Memory” Errors.
If you cannot reduce the amount of memory your code requires, consider increasing the memory resources available to your workers.
If you are using a pool on the local machine, scale up your parallel code to an onsite or cloud cluster. You can distribute large arrays across multiple machines. To learn more, see Scale Up from Desktop to Cluster.
If you are using a pool on a cluster, increase the system memory available to each worker before you start the parallel pool.
Check for Resource Contention. Resource contention can delay communication signals between workers, potentially disrupting the pool. Resource contention can occur when multiple workers access the cluster node's CPU, memory, or network at the same time. Some workers might have to wait because of limited resource bandwidth, which can delay communication signals between workers enough to disrupt the pool. To mitigate resource contention, consider these strategies:
Distribute tasks evenly across workers to ensure balanced usage of CPU, memory, and other resources. Adjust the number of workers or the size of tasks to match the resources available on the parallel pool. Use the Pool Dashboard to explore which functions take the most time on each worker and identify tasks that are unevenly distributed across the workers. For more information, see Monitor Pool Workers with Pool Dashboard.
Before R2025a: To identify which functions take the most time on each worker and identify tasks that are unevenly distributed across the workers, use
mpiprofile. For detailed steps, see Profiling Parallel Code.If you have data, you can reduce unnecessary network access by moving the data to the cluster storage. Use the
addpathfunction to add their location to the workers' search paths.
Check for Network Instability. Network latency or dropped connections can also cause disruptions in the parallel pool.
To measure the stability of the connections between your MATLAB client and the cluster, validate your cluster profile in the Cluster Profile Manager.
To open the Cluster Profile Manager, on the Home tab, in the Environment section, select Parallel > Create and Manage Clusters.
Choose the profile you want to validate.
On the Validate tab, select Validate.
Review the Cluster connection test (parcluster) stage results for any warnings or errors related to network latency. A latency of more than 300 ms results in a high latency stage warning. Investigate potential causes like network interference, poor infrastructure, or long distances between the client and cluster nodes.