Main Content

plot

Plot pulse waveform

Since R2023a

Description

example

plot(waveform) plots the real part of the waveform.

plot(waveform,Name=Value) plots the waveform with additional options specified by one or more (Name=Value) pair arguments.

plot(waveform,Name=Value,LineSpec) specifies the same line color, line style, or marker options as are available in the MATLAB® plot function.

hndl = plot(___) returns the line handle in the figure.

Examples

collapse all

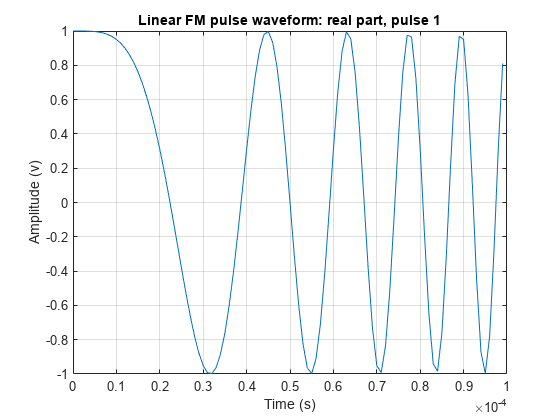
Create and plot an upsweep linear FM pulse waveform.

waveform = phased.LinearFMWaveform('SweepBandwidth',1e5,'PulseWidth',1e-4);
plot(waveform);

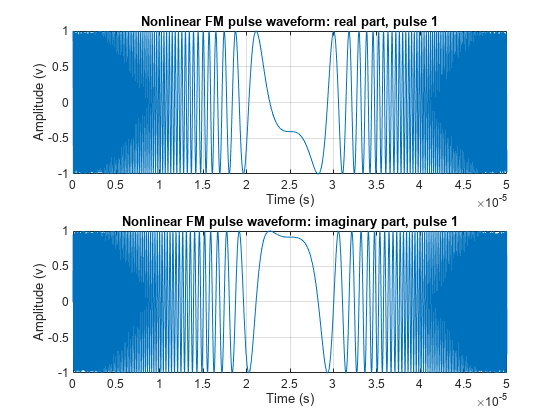
Create and plot a quadratic FM pulse waveform. The pulse has a 10 MHz bandwidth and 50 μsec duration. The pulse sample rate is 10 times the bandwidth.

BW = 10e6;
T = 50e-6;
waveform = phased.NonlinearFMWaveform( ...
    'SampleRate',10*BW,'SweepBandwidth',BW, ...
    'PulseWidth',T);
plot(waveform,PlotType='complex')

Input Arguments

collapse all

Pulse waveform, specified as a System object.

Character vector to specifies the same line color, style, or marker options as are available in the MATLAB plot function. If you specify a PlotType value of 'complex', then LineSpec applies to both the real and imaginary subplots.

Name-Value Arguments

Specify optional pairs of arguments as Name1=Value1,...,NameN=ValueN, where Name is the argument name and Value is the corresponding value. Name-value arguments must appear after other arguments, but the order of the pairs does not matter.

Before R2021a, use commas to separate each name and value, and enclose Name in quotes.

Example: plot(waveform,PlotType='complex',pulseidx=4)

Specifies whether the function plots the real part, imaginary part, or both parts of the waveform. Valid values are 'real', 'imag', and 'complex'.

Example: 'complex'

Data Types: char | string

Index of the pulse to plot. This value must be a scalar.

Example: 4

Data Types: double

Frequency offset, specified as a scalar. Units are in Hz.

Example: -100

Data Types: double

Frequency offset source, specified as a scalar. Units are in Hz.

Example: 'Input port'

Data Types: double

Output Arguments

collapse all

Handle to the line or lines in the figure. For a PlotType value of 'complex', hndl is a column vector. The first and second elements of this vector are the handles to the lines in the real and imaginary subplots, respectively.

Version History

Introduced in R2023a