plotTDOASpectrum
Syntax
Description
Create and plot the signal time-difference-of-arrival (TDOA) spectrum for anchor pair.
[
creates and plots the time-difference-of-arrival (TDOA) grid, tdoagrid,tdoaspectrum,tdoaest] = plotTDOASpectrum(estimate)tdoagrid,
the TDOA spectrum, tdoaspectrum, and the estimated TDOA,
tdoaest, for the first anchor pair derived from the phased.TDOAEstimator
System object™
estimate.
To use this function, first create and execute the phased.TDOAEstimator
System object.
[
also specifies one or more Name-Value arguments, in addition to the input arguments from the
previous syntax . For example, tdoagrid,tdoaspectrum,tdoaest] = plotTDOASpectrum(estimate,Name=Value)AnchorPairIndex=4 specifies the fourth
anchor pair in the channel (see Name-Value Arguments). You can specify multiple name-value pair arguments in any order as
Name1=Value1,...,NameN=ValueN.
Examples
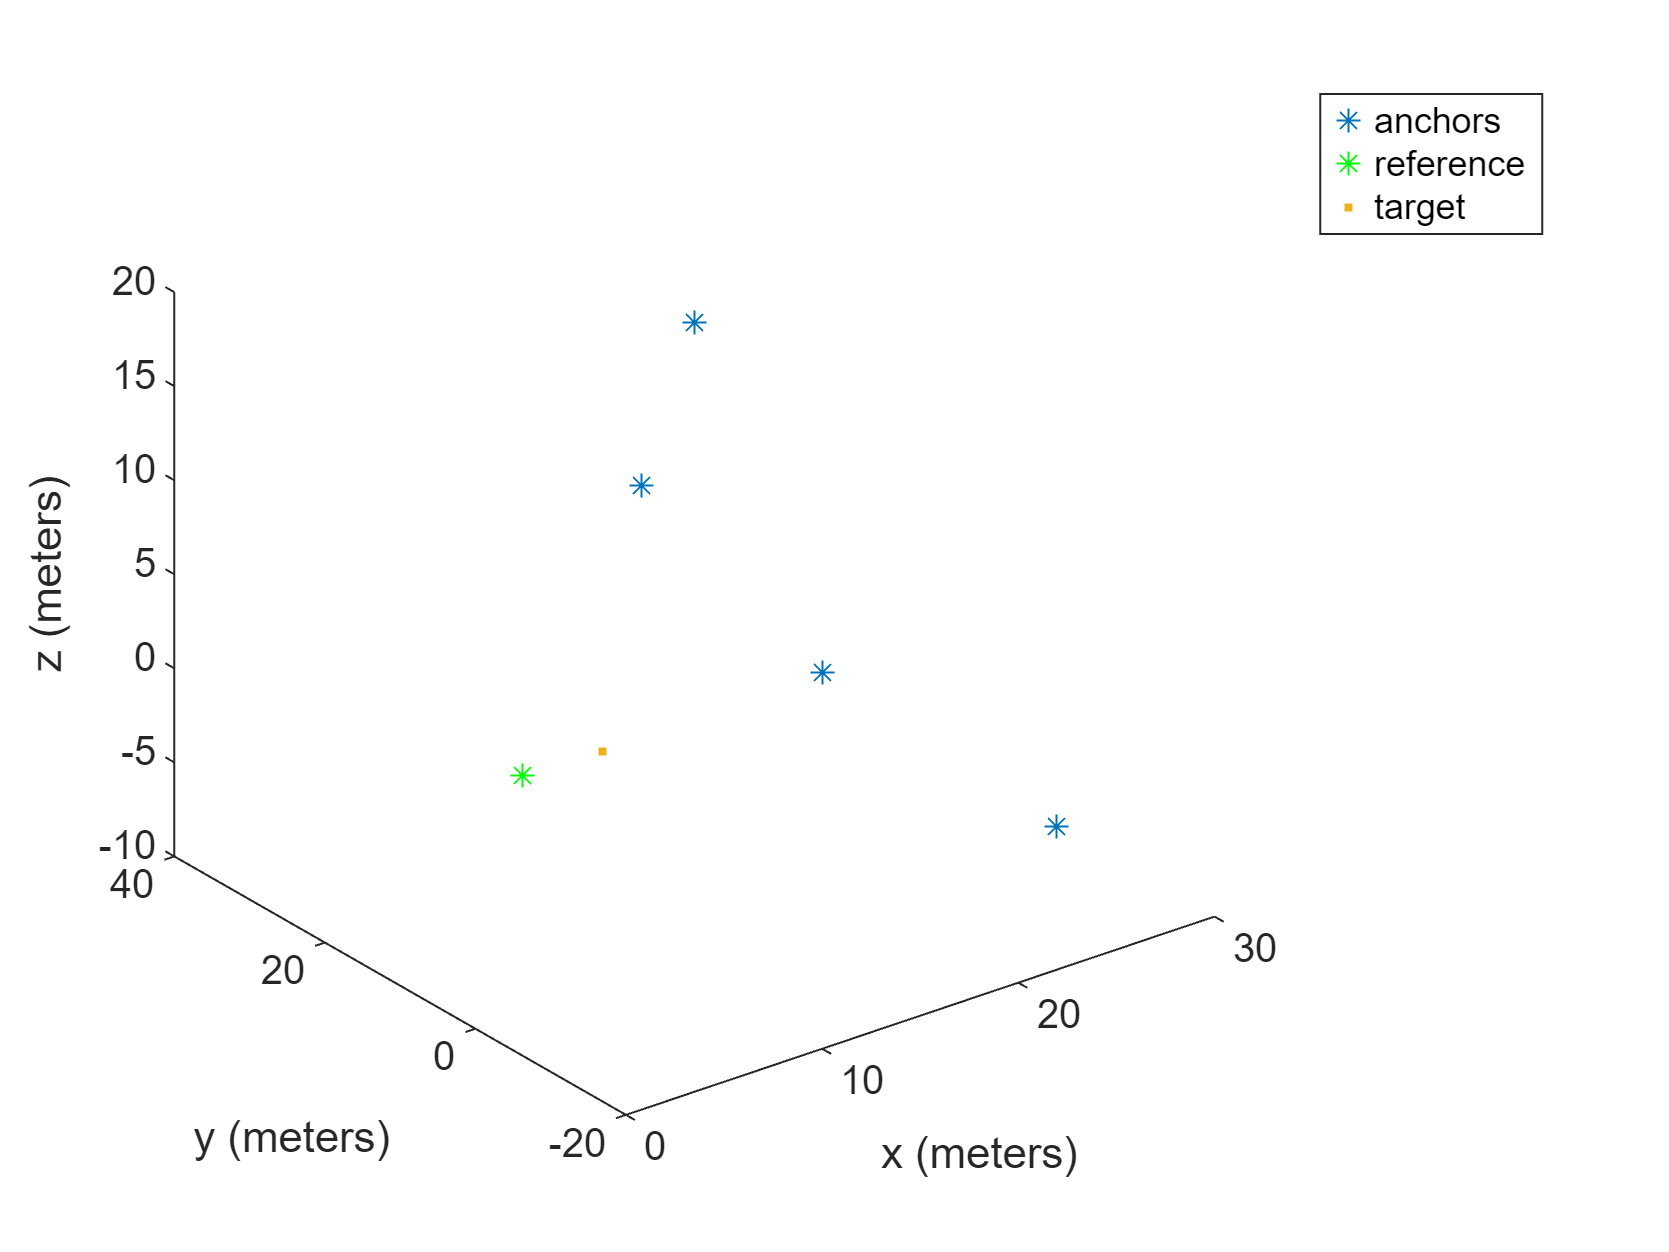
Start with signals from five anchors with known positions. Perform TDOA estimation by applying the GCC-PHAT algorithm in phased.TDOAEstimator System object™ on the received signals from a target. The TOAEstimatorExampleData MAT file contains the variables needed in this example:
Xtime | Time-domain received signals |
fs | Sample rate (Hz) |
toa | Time-of-arrival at each anchor |
anchorpos | Anchor positions |
npow | Noise power |
Load data from the MAT file.
load TOAEstimatorExampleDataPlot the anchor positions and target position.
plot3(anchorpos(1,:),anchorpos(2,:),anchorpos(3,:),'*')
hold on
plot3(anchorpos(1,1),anchorpos(2,1),anchorpos(3,1),'*g')

plot3(tgtpos(1),tgtpos(2),tgtpos(3),'.')
xlabel('x (meters)')
ylabel('y (meters)')
zlabel('z (meters)')
hold off
legend('anchors','reference','target')
Create a TDOA estimator.
estimator = phased.TDOAEstimator(SampleRate=fs,NumEstimates=1, ...
    VarianceOutputPort=true,NoisePower=npow);
Perform the TDOA estimation.
tdoaest = estimator(Xtime)*10^9;
Obtain the true TDOA in ns from the MAT file.
tdoatruth = (toa(2:end) - toa(1))*10^9
tdoatruth = 1×4

   55.7611   58.8663   69.5528   43.5516
tdif = tdoaest - tdoatruth
tdif = 1×4

    0.2389    0.1337    0.4472    0.4484
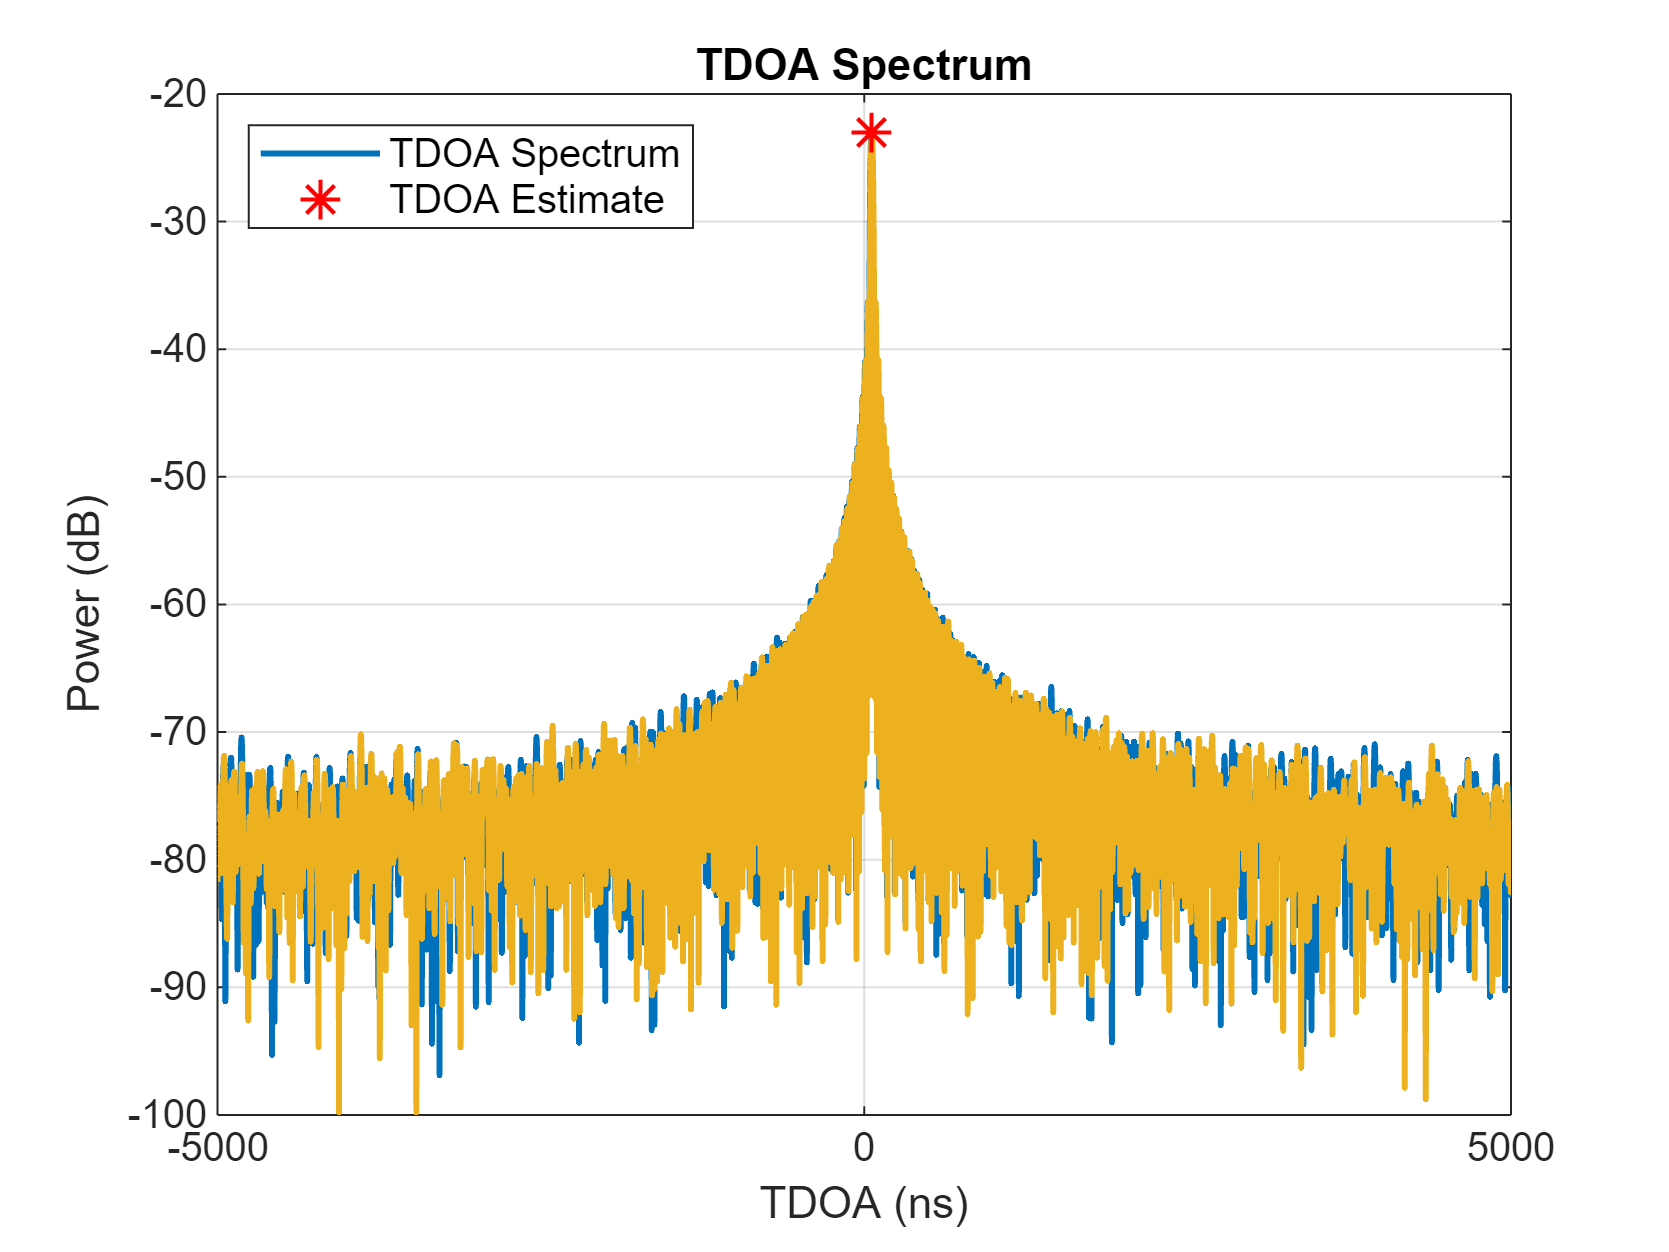
Plot the TDOA spectrum for the first anchor pair (default).
plotTDOASpectrum(estimator)
Overlay the plot of the TDOA spectrum for the second anchor pair.
plotTDOASpectrum(estimator,AnchorPairIndex=2)
Input Arguments
Name-Value Arguments
Output Arguments
Version History
Introduced in R2024b
See Also
phased.TOAEstimator | phased.TDOAEstimator | toaposest | tdoaposest | plotTOASpectrum