Automate C/C++ Code Profiling Using Polyspace Platform Projects
Using Polyspace® Test™, you can calculate C/C++ code profiling metrics, such as code coverage, execution time, and memory use:
The metric
Code Coveragemeasures how much of your code is validated by the existing test cases. Measure the value of different code coverage metrics by using Polyspace Test and add appropriate test cases to achieve your desired level of coverage. Polyspace Test calculates code coverage for standard metrics. See Review Code Profiling Results.The metric
Execution Timecomputes the time required to execute the different callable entities of your code. SeeExecution Time.The metric
Memory Usemeasures how the callable entities use the available stack memory. SeeMemory Use.
The steps for calculating these metrics depend on your test authoring workflow:
If you create your tests graphically, you can:
Calculate these metrics in the Polyspace Platform user interface.
Automate the calculation by using the Polyspace Test command-line interface.
If you author your tests by using the Polyspace Test xUnit API, you can calculate these metrics by using your own toolchain and the
polyspace-code-profilercommand.
This example shows how to automate the calculation of code profile metrics by using the Polyspace Test command line interface.
Configure Project
To calculate the code profiling metrics using the Polyspace
Test command line interface, you require a Polyspace
Test project (.psprjx) file containing C/C++ source files and corresponding tests. To follow this example, open the Polyspace Platform user interface and create a new project.
After creating the project, find the file example.c in the folder <polyspaceroot>\polyspace\examples\doc_pstest\coverage_data_collection\src and add the source file to your project.
To calculate the code profiling metrics, you require at least one test case. Analyze the source files and add these test cases:
foo(2,0)==2bar(1,1,0)==0bar(1,1,1)==1bar(1,0,1)==1bar(0,1,1)==1
For details about creating a project, adding source files, and creating tests graphically, see Write C/C++ Unit Tests in Polyspace Platform User Interface.
Calculate Code Profiling Metrics
Once you configure your project, you can calculate the code coverage, execution time, or memory use metrics at the command line.
Calculate the code profiling metric you want. You can calculate one of the three code profiling metrics at a time.
To calculate the code coverage programmatically, at the command line, enter:
polyspace-test -run -project <project>.psprjx -results-dir <Results> -profiling-mode coverageTo calculate the execution time programmatically, enter:
polyspace-test -run -project <project>.psprjx -results-dir <Results> -profiling-mode execution-profileTo calculate the memory use programmatically, enter:
polyspace-test -run -project <project>.psprjx -results-dir <Results> -profiling-mode stack-profile
Here:
<project>.psprjxis the Polyspace Test project that you want to run.<Results>is the folder where Polyspace Test stores the results.The option
-profiling-modespecifies which metric to calculate:coverage— Activates code coverage calculationexecution-profile— Activates execution time calculationstack-profile— Activates memory use calculation
Verify that a
.psproffile is stored in theResultsfolder. This file contains the code profiling results.Review the results. You can review the results in the Polyspace Platform user interface or in an HTML report.
To review code profiling results using the Polyspace platform user interface, open the
.psproffile using the Polyspace Platform user interface. For instance, review the code coverage of the five added tests: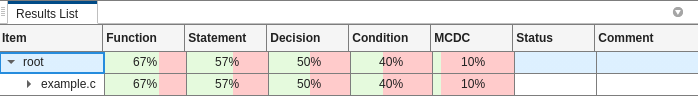
For more information about reviewing code coverage results, see Review C/C++ Code Coverage Results in Polyspace Platform User Interface.
For execution time and memory use results, Polyspace platform converts the results in the
.psprofinto an HTML report and opens the HTML in your default web browser.You can convert the results in the
.psproffile into an HTML report at the command-line. To create an HTML report, at the command line, enter:Verify that Polyspace Test creates the HTML report inpolyspace-test -report -html -report-dir <reportFolder> <Results><reportFolder>. For more information about reviewing the HTML report, see Structure of HTML Reports Generated from C/C++ Code Profiling Results.You can upload the results to Polyspace Access™ directly at the command line using the command
polyspace-access.
See Also
polyspace-code-profiler | polyspace-test -build | polyspace-test -run