Justify Missing Coverage Using Results from Polyspace Static Analysis
Static analysis and dynamic testing of source code can complement each other. For instance, consider that you have a branch in your code that is unreachable. The branch can be temporarily unreachable while under development. Alternatively, the branch can be part of defensive code that is unreachable under normal operating conditions. You can avoid writing dynamic tests for such unreachable branches during development by importing Polyspace® static analysis results. If the static analysis identifies the code as unreachable, Polyspace Test™ justifies their missing coverage outcomes. The best practice is to make all branches of your code reachable and testable at the end of development.
This example shows how you can identify unreachable code by using Polyspace static analysis tools and then justify the missing coverage of the unreachable code by importing the static analysis results into Polyspace Test coverage results.
Prerequisites and Example Files
To follow this workflow:
Copy and paste this code in the file
source.cfile in a writable folder, say,workingDir.Copy and paste definition of the enum#include "source.h" int angleLookUp(directions D) { int dir; switch(D) { case East: dir = 45; break; case West: dir = 225; break; case North: dir = 135; break; case South: dir = 315; break; default: //Defensive code dir = -1; break; } return dir; }directionsin the header filesource.hin the same folder.In this code, thetypedef enum { East = 1, West, North, South } directions;defaultcase in the functionangleLookUp()is defensive code. Under normal operating conditions, thisdefaultcase is not reachable. To comply with coding standards, thedefaultcase is still necessary.You require a valid Polyspace Bug Finder™ or Polyspace Code Prover™ license as well as a valid Polyspace Test license.
This tutorial shows how to justify missing coverage of unreachable code starting from your source files. Alternatively, you can use a pre-configured project to explore justification of missing coverage using static analysis results. See Get Started with Polyspace Test Using Example Project.
Identify Unreachable Code Using Static Analysis
You can find unreachable code results using either of Polyspace
Bug Finder or Polyspace
Code Prover. Polyspace
Code Prover performs a more exhaustive analysis compared to Polyspace
Bug Finder. Use the defect Unreachable code (Polyspace Bug Finder) or the runtime check Unreachable code (Polyspace Code Prover) to identify unreachable code. The static analysis produces a results file containing unreachable code results, which you can later import into coverage results.
This example uses Polyspace Code Prover to detect unreachable code.
User Interface
To identify unreachable code by using the Polyspace Platform user interface, run a static analysis on your source code. See Run Static Analysis in Polyspace Platform User Interface (Polyspace Code Prover).
Code Prover reports the unreachable code as a gray check in the Results Details pane.
Command Line
To detect unreachable code at the command line, run a Code Prover verification. A Code Prover verification requires a main() function. If you are verifying a module that lacks a main() function, specify the option Verify module or library (-main-generator) (Polyspace Code Prover). To verify source.c at the command line,
enter:
polyspace-code-prover -sources source.c -results-dir cpResults -main-generator
Unreachable code (Polyspace Code Prover) check for the default case in the function angleLookUp(). The results are stored in the file cpResults/ps_results.pscpCalculate Code Coverage
To calculate code coverage, add test cases for the function angleLookUp(). To add test cases for the function, specify the folder workingDir as an include folder using the option Include paths (-I). The , consider these test cases:
angleLookUp(East)== 45angleLookUp(West)== 225angleLookUp(North)== 135angleLookUp(South)== 315
You can calculate the code coverage of these tests by either using the Polyspace Platform user interface or at the command line. For details about different workflows for calculating the code coverage, see:
With the preceding test cases, the calculated values of the code coverage metrics are:
Function Coverage— 100%Statement Coverage— 85%Decision Coverage— 80%
The default outcome is not covered.
Import Static Analysis Result
In this example, the unreachable defensive code is required to comply with coding standards. By importing static analysis results, you justify the missing coverage and reach your coverage goal.
You can import the static analysis results by using the Polyspace Platform user interface or the Polyspace
Test command line interface. To import the static analysis results successfully, keep the source data base (ps_sources.db) in the same folder as your results file (*.pscp or *.psbf).
Once you apply the static analysis result to justify the missing coverage, the justification propagates. See Rules for Propagating Code Coverage Justifications Across Multiple Results.
User Interface
After you calculate the code coverage results:
Open the coverage results by using the Polyspace Platform user interface. See Open Polyspace Results in Polyspace Platform User Interface.
Click Show Outcomes to see all the outcomes,
To import the static analysis results, in the Review tab, click Import > Import Unreachable Code Results and navigate to
cpResults/ps_results.pscp
Polyspace automatically justifies the default outcome in angleLookUp() and marks the results in cyan. The justified outcome is marked as UNREACHABLE CODE in the user interface to indicate that the decision is justified using static analysis results.
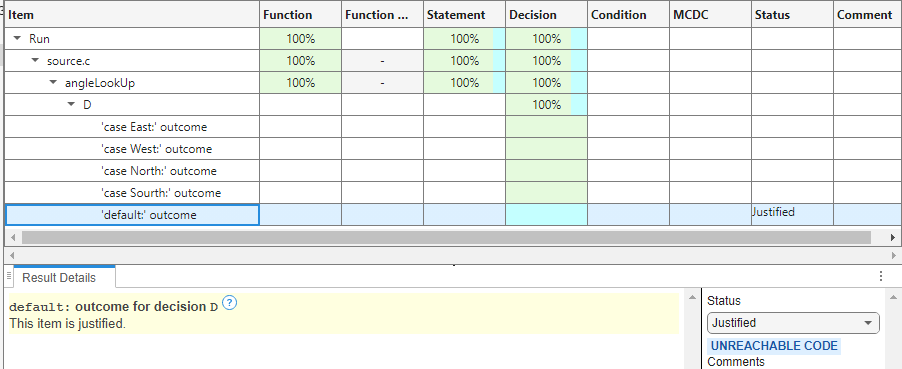
After the justification, code coverage metrics reach 100%, indicating that the missing coverage is caused by unreachable code.
Command Line
At the command line, you review code coverage results by generating a readable report from a *.psprof file. Apply the static analysis results to your *.psprof file before generating the report:
polyspace-code-profiler -justify-uncovered-dead-code
  -rationale "Rationale"
  cpResults/ps_results.pscp output_run.psprof
-rationaleis an optional command. You can use this to add a comment, such as"Rationale", that explains why the unreachable results are justified.output_run.psprofcpResults/ps_results.pscp
To generate a report containing the justified results, enter this code at the command line:
polyspace-code-profiler -report -html -report-dir reportFolder output_run.psprof
reportFolderdefault outcome of the function angleLookUp() as unreachable and justifies its missing coverage. After the justification, code coverage metrics reach 100%.See Also
Topics
- Calculate C/C++ Code Profiling Metrics in Polyspace Platform User Interface
- Automate C/C++ Code Profiling Using Polyspace Platform Projects
- Calculate C/C++ Code Coverage Using Self-Managed Builds
- Improve or Justify Missing Code Coverage Results
- Rules for Propagating Code Coverage Justifications Across Multiple Results