mlreportgen.ppt.TableEntry Class
Namespace: mlreportgen.ppt
Table entry
Description
Use an object of the mlreportgen.ppt.TableEntry class to create a table
entry to add to a row of a table in a PPT API presentation.
To add content to a table entry, append a character vector or one or more
mlreportgen.ppt.Paragraph objects to the
TableEntry object.
The mlreportgen.ppt.TableEntry class is a handle class.
Class Attributes
HandleCompatible | true |
ConstructOnLoad | true |
For information on class attributes, see Class Attributes.
Creation
Description
tableEntryObj = mlreportgen.ppt.TableEntryTableEntry object.
Properties
Font family for the text, specified as a character vector or string scalar. Specify a font that appears in the font list in Microsoft® PowerPoint®. To see the font list, in PowerPoint, on the Home tab, in the Font group, click the arrow to the right of the font.
Attributes:
GetAccess | public |
SetAccess | public |
NonCopyable | true |
Data Types: char | string
Font family for complex scripts, specified as a character vector or string scalar. Specify a font family to use when substituting in a locale that requires a complex script, such as Arabic or Asian, to render text.
Attributes:
GetAccess | public |
SetAccess | public |
NonCopyable | true |
Data Types: char | string
Font color for the text, specified as a character vector or string scalar that contains a CSS color name or hexadecimal RGB value.
| Format | Value |
|---|---|
| CSS color name | Specify a CSS color name. For a list of CSS color names, see https://www.w3.org/wiki/CSS/Properties/color/keywords. |
| Hexadecimal RGB value | Use the format "#RRGGBB". Use # as the first character and two-digit hexadecimal numbers for the red, green, and blue values. You can use uppercase or lowercase letters. |
Example: "red" specifies a red color using a CSS color name.
Example: "#0000ff" specifies a blue color using a hexadecimal RGB value.
Attributes:
GetAccess | public |
SetAccess | public |
NonCopyable | true |
Data Types: char | string
Font size of the text, specified as a character vector or string scalar that contains a number followed by a unit of measurement. For example, "11pt"
specifies 11 points. Valid abbreviations are:
"px"— Pixels"cm"— Centimeters"in"— Inches"mm"— Millimeters"pc"— Picas"pt"— Points
You can also specify pixels by omitting the unit. For example, "5"
specifies 5 pixels.
Attributes:
GetAccess | public |
SetAccess | public |
NonCopyable | true |
Data Types: char | string
Background color, specified as a character vector or string scalar that contains a CSS color name or hexadecimal RGB value.
| Format | Value |
|---|---|
| CSS color name | Specify a CSS color name. For a list of CSS color names, see https://www.w3.org/wiki/CSS/Properties/color/keywords. |
| Hexadecimal RGB value | Use the format "#RRGGBB". Use # as the first character and two-digit hexadecimal numbers for the red, green, and blue values. You can use uppercase or lowercase letters. |
Setting the BackgroundColor property adds a
mlreportgen.ppt.BackgroundColor format object to the
Style property. Setting the BackgroundColor
property to an empty value removes the object.
Example: "red" specifies a red color using a CSS color name.
Example: "#0000ff" specifies a blue color using a hexadecimal RGB value.
Attributes:
GetAccess | public |
SetAccess | public |
NonCopyable | true |
Data Types: char | string
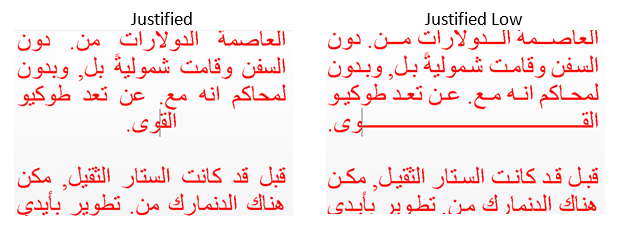
Horizontal alignment of the content, specified as a character vector or string scalar. Specify one of the values in the table.
| Value | Description |
|---|---|
| Centered |
| Left-justified |
| Right-justified |
| Left and right-justified, spacing words evenly |
| Left and right-justified, spacing letters evenly |
| Left and right-justified Thai text, spacing characters evenly |
| Justification for Arabic text
|
Attributes:
GetAccess | public |
SetAccess | public |
NonCopyable | true |
Data Types: char | string
Vertical alignment of the content, specified as one of these values:
| Value | Description |
|---|---|
| Vertically aligned to the top |
| Vertically aligned to the bottom of the table entry |
| Vertically aligned to the middle of the table entry |
| Vertically aligned to the top and horizontally aligned to the center of the table entry |
| Vertically aligned to the bottom and horizontally aligned to the center of the table entry |
| Vertically aligned to the middle and horizontally aligned to the center of the table entry |
Attributes:
GetAccess | public |
SetAccess | public |
NonCopyable | true |
Data Types: char | string
Orientation of the text, specified as one of these values:
| Value | Description |
|---|---|
"horizontal" | Text orientation is horizontal. |
"down" | Text orientation is vertical, with the content rotated 90 degrees, clockwise. |
"up" | Text orientation is vertical, with the content rotated 90 degrees, counterclockwise. |
Attributes:
GetAccess | public |
SetAccess | public |
NonCopyable | true |
Number of columns spanned by this table entry, specified as a double.
To create a table that has an entry that spans multiple columns, build the
table from mlreportgen.ppt.TableEntry and
mlreportgen.ppt.TableRow objects. See Create Table Entries That Span Multiple Columns. In
the row that contains the entry that spans columns, define the entry for the
first column of the span. Do not define entries for the other columns in the
span.
An entry that spans columns shares a border with the entry that is in the row below and in the first column of the span. The bottom border of the spanning entry determines the style of the shared border. In the row that contains the spanning entry, the entries for the second through last columns of the span are undefined. The top borders of the corresponding entries in the row below determine the borders under the undefined entries. To specify the border under the spanning entry for the entire column span:
Specify the bottom border of the entry that spans the columns.
In the next row, specify the top borders of the entries in the second through last columns of the span.
For an example, see Customize Bottom Border of Entry That Spans Multiple Columns.
Attributes:
GetAccess | public |
SetAccess | public |
NonCopyable | true |
Data Types: double
Number of rows spanned by this table entry, specified as a double.
To create a table that has an entry that spans multiple rows, build the
table from mlreportgen.ppt.TableEntry and
mlreportgen.ppt.TableRow objects. See Create Table Entries That Span Multiple Rows. In
the column that contains the entry that spans rows, define the entry for the
first row of the span. Do not define entries for the other rows in the
span.
An entry that spans rows shares a border with the entry that is in the column to the right and in the first row of the span. The right border of the spanning entry determines the style of the shared border. In the column that contains the spanning entry, the entries for the second through last rows of the span are undefined. The left borders of the corresponding entries in the column to the right determine the right borders of the undefined entries. To specify the right border of the spanning entry for the entire row span:
Specify the right border of the entry that spans the rows.
In the next column, specify the left borders of the entries in the second through last rows of the span.
For an example, see Customize Right Border of Entry That Spans Multiple Rows.
Attributes:
GetAccess | public |
SetAccess | public |
NonCopyable | true |
Data Types: double
Table entry border style, specified as a character vector or string scalar. Specify one of these values:
"none""solid""dot""dash""largeDash""dashDot""largeDashDot""largeDashDotDot""systemDash""systemDot""systemDashDot""systemDashDotDot"
Note
A conflict occurs if a border segment is shared by two table entries. For a conflicting horizontal border segment, PowerPoint ignores the formats specified by the entry on the bottom. For a conflicting vertical border segment, PowerPoint ignores the formats specified by the entry on the right.
Attributes:
GetAccess | public |
SetAccess | public |
NonCopyable | true |
Data Types: char | string
Table entry border color, specified as a character vector or string scalar that contains a CSS color name or hexadecimal RGB value.
| Format | Value |
|---|---|
| CSS color name | Specify a CSS color name. For a list of CSS color names, see https://www.w3.org/wiki/CSS/Properties/color/keywords. |
| Hexadecimal RGB value | Use the format "#RRGGBB". Use # as the first character and two-digit hexadecimal numbers for the red, green, and blue values. You can use uppercase or lowercase letters. |
Example: "red" specifies a red color using a CSS color
name.
Example: "#0000ff" specifies a blue color using a
hexadecimal RGB value.
Attributes:
GetAccess | public |
SetAccess | public |
NonCopyable | true |
Data Types: char | string
Table entry border width, specified as a character vector or string scalar that contains
a number followed by an abbreviation for a unit of measurement. For example, "3pt" specifies three points.
Valid abbreviations are:
"px"— Pixels"cm"— Centimeters"in"— Inches"mm"— Millimeters"pc"— Picas"pt"— Points
You can also specify pixels by omitting the unit. For example, "5"
specifies 5 pixels.
Attributes:
GetAccess | public |
SetAccess | public |
NonCopyable | true |
Data Types: char | string
Since R2026a
Inner margin of table entry, specified as a character vector or string scalar that contains
a number followed by an abbreviation for a unit of measurement. For example, "3pt" specifies three points.
Valid abbreviations are:
"px"— Pixels"cm"— Centimeters"in"— Inches"mm"— Millimeters"pc"— Picas"pt"— Points
You can also specify pixels by omitting the unit. For example, "5"
specifies 5 pixels.
Attributes:
GetAccess | public |
SetAccess | public |
NonCopyable | true |
Data Types: char | string
Table entry formatting, specified as a cell array of PPT format objects.
Formats that do not apply to a TableEntry object are
ignored.
Attributes:
GetAccess | public |
SetAccess | public |
NonCopyable | true |
Data Types: cell
Child elements of this object, specified as a cell array of PPT API objects.
Attributes:
GetAccess | public |
SetAccess | private |
NonCopyable | true |
Data Types: cell
Tag, specified as a character vector or string scalar. The PPT API generates a
session-unique tag as part of the creation of this object. The generated tag has the
form CLASS:ID, where
CLASS is the object class and
ID is the value of the
Id property of the object. Use this value to help identify
where an issue occurs during presentation generation.
Attributes:
GetAccess | public |
SetAccess | public |
NonCopyable | true |
Data Types: char | string
Object identifier, specified as a character vector or string scalar. The PPT API
generates a session-unique identifier when it creates the presentation element object.
You can specify your own value for Id.
Attributes:
GetAccess | public |
SetAccess | public |
NonCopyable | true |
Data Types: char | string
Methods
Examples
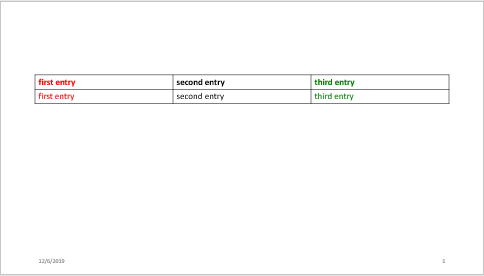
Create a table for a presentation by adding entries to rows and the rows to a table.
Create a presentation.
import mlreportgen.ppt.*
ppt = Presentation('myTableRowPresentation.pptx');
open(ppt);
Add a slide to the presentation.
add(ppt,'Title and Content');Create a table.
table = Table();
Create the first table row.
tr1 = TableRow();
tr1.Style = [tr1.Style {Bold(true)}];
Create the table entries for the first row.
te1tr1 = TableEntry();
p = Paragraph('first entry');
p.FontColor = 'red';
append(te1tr1,p);
append(tr1,te1tr1);

te2tr1 = TableEntry();
append(te2tr1,'second entry');
append(tr1,te2tr1);

te3tr1 = TableEntry();
te3tr1.FontColor = 'green';
append(te3tr1,'third entry');
append(tr1,te3tr1);
Append the first table row to the table.
append(table,tr1);
Create the second table row, append the table entries to the row, and append the row to the table.
tr2 = TableRow();
te1tr2 = TableEntry();
te1tr2.FontColor ='red';
p = Paragraph('first entry');
append(te1tr2,p);
append(tr2,te1tr2);

te2tr2 = TableEntry();
append(te2tr2,'second entry');
append(tr2,te2tr2);

te3tr2 = TableEntry();
te3tr2.FontColor = 'green';
append(te3tr2,'third entry');
append(tr2,te3tr2);
append(table,tr2);
Add the table to the presentation.
contents = find(ppt,'Content');
replace(contents(1),table);
Close and view the presentation.
close(ppt);
rptview(ppt);
Here is the table in the generated presentation:
Use the ColSpan property to specify that a table entry spans multiple columns.
Create a presentation.
import mlreportgen.ppt.*
ppt = Presentation("myColSpan.pptx");
open(ppt);
Add a slide to the presentation.
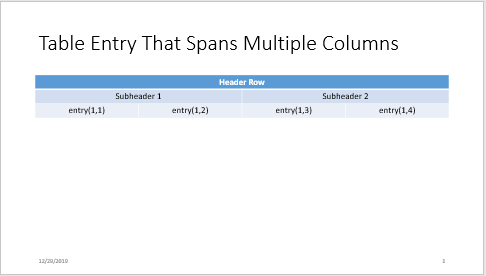
slide = add(ppt,"Title and Table");Create a table that has four columns.
t = Table(4);
t.StyleName = "Medium Style 2 - Accent 1";
t.Style = {VAlign("middleCentered")};
Create the header row. This row has a single table entry that spans all four columns.
tr1 = TableRow();
tr1te1 = TableEntry("Header Row");
tr1te1.ColSpan = 4;
append(tr1,tr1te1);
append(t,tr1);
Create the subheader row. This row has two table entries, each of which spans two columns.
tr2 = TableRow();
tr2te1 = TableEntry("Subheader 1");
tr2te1.ColSpan = 2;
append(tr2,tr2te1);
tr2te2 = TableEntry("Subheader 2");
tr2te2.ColSpan = 2;
append(tr2,tr2te2);
append(t,tr2);
Create the content row. This row has four table entries each of which spans a single column.
tr3 = TableRow();
append(tr3,TableEntry("entry(1,1)"));
append(tr3,TableEntry("entry(1,2)"));
append(tr3,TableEntry("entry(1,3)"));
append(tr3,TableEntry("entry(1,4)"));
append(t,tr3);
Add a title and the table to the slide.
replace(slide,"Title","Table Entry That Spans Multiple Columns");
replace(slide,"Table",t);
Close and view the presentation.
close(ppt);
rptview(ppt);
Here is the slide in the generated presentation:
Use the RowSpan property to specify that a table entry spans multiple rows.
Create a presentation.
import mlreportgen.ppt.*
ppt = Presentation("myRowSpan.pptx");
open(ppt);
Add a slide to the presentation.
slide = add(ppt,"Title and Table");Create a table that has three columns.
t = Table(3);
t.Style = [t.Style {VAlign("middleCentered")}];
Create the first table row.
tr1 = TableRow();
Create an entry in the first column that spans all four rows.
tr1te1 = TableEntry("Header Column");
tr1te1.RowSpan = 4;
append(tr1,tr1te1);
Create an entry in the second column that spans the first two rows.
tr1te2 = TableEntry("Subheader 1");
tr1te2.RowSpan = 2;
append(tr1,tr1te2);
Create an entry in the third column that spans one row.
append(tr1,TableEntry("entry(1,1)"));
append(t,tr1);
Create the second table row. Create the third column entry. The first and second column entries are already defined because the first and second column entries span the first two rows.
tr2 = TableRow();
append(tr2,TableEntry("entry(2,1)"));
append(t,tr2);
Create the third table row and create the entries for the second and third columns. Make the second column entry span two rows. The first column entry is already defined because the row one, column one entry spans all of the rows.
tr3 = TableRow();
tr3te2 = TableEntry("Subheader 2");
tr3te2.RowSpan = 2;
append(tr3,tr3te2);
append(tr3,TableEntry("entry(3,1)"));
append(t,tr3);
Create the fourth table row. Create the entry for only the third column. The first and second column entries are already defined by previous rows that span multiple columns.
tr4 = TableRow();
append(tr4,TableEntry("entry(4,1)"));
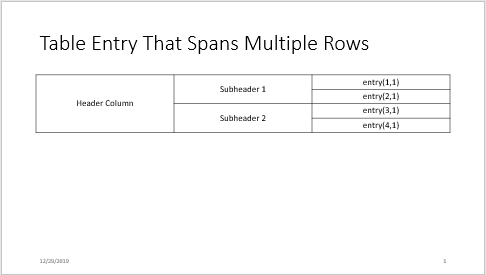
append(t,tr4);Add a title and the table to the slide.
replace(slide,"Title","Table Entry That Spans Multiple Rows");
replace(slide,"Table",t);
Close and view the presentation.
close(ppt);
rptview(ppt);
Here is the slide in the generated presentation:
To customize the bottom border of an entry that spans multiple columns:
Specify the bottom border of the entry that spans the columns. This specification determines the border that is shared with the entry in the next row that is in the first column of the span.
In the next row, specify the top borders of the entries that are in the remaining columns of the span.
This example defines a table that has two rows and three columns. The entry in row one and column one spans three columns. To make the bottom border of this entry red along the entire span, the example specifies that:
The bottom border of the row one, column one entry is red.
The top borders of the row two, column two and row two, column three entries are red.
Create a presentation.
import mlreportgen.ppt.*
ppt = Presentation("myColSpanBorder.pptx");
open(ppt);
Add a slide to the presentation.
slide = add(ppt,"Title and Table");Create a table that has three columns.
t = Table(3);
t.Style = [t.Style {VAlign("middleCentered")}];
Create the first row of the table.
tr1 = TableRow();
Create the first entry of the first row and specify that the entry spans three columns. Specify that the bottom border of the entry is red. Append the entry to the row.
te11 = TableEntry("entry 1,1");
te11.ColSpan = 3;
border = Border();
border.BottomColor = 'red';
te11.Style = [te11.Style {border}];
append(tr1,te11);
Create the second row of the table.
tr2 = TableRow();
Create the first entry of the second row and append the entry to the row. The top border of this entry is determined by the bottom border of the row one, column one entry.
te21 = TableEntry("entry 2,1");
append(tr2,te21);
Create the second entry of the second row, specify that the top border is red, and append the entry to the row.
te22 = TableEntry("entry 2,2");
b = Border();
b.TopColor = 'red';
te22.Style = [te22.Style {b}];
append(tr2,te22);
Create the third entry of the second row, specify that the top border is red, and append the entry to the row.
te23 = TableEntry("entry 2,3");
b = Border();
b.TopColor = 'red';
te23.Style = [te23.Style {b}];
append(tr2,te23);
Append the rows to the table.
append(t,tr1);
append(t,tr2);
Add a title and the table to the slide.
replace(slide,"Title","Table Entry That Spans Multiple Columns");
replace(slide,"Table",t);
Close and view the presentation.
close(ppt);
rptview(ppt);
The bottom border of the first row entry is red along the entire span.

To customize the right border of an entry that spans multiple rows:
Specify the right border of the entry that spans the rows. This specification determines the border that is shared with the entry in the next column that is in the first row of the span.
In the next column, specify the left border of the entries that are in the remaining rows of the span.
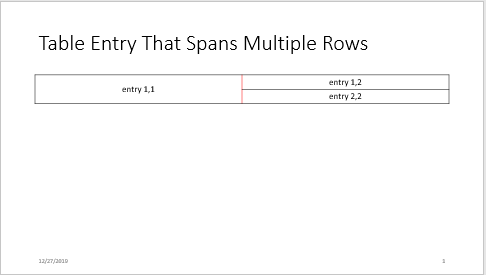
This example defines a table that has two rows and two columns. The entry in row one and column one spans two rows. To make the right border of this entry red along the entire span, the example specifies that:
The right border of the row one, column one entry is red.
The left border of the row two, column two entry is red.
Create a presentation.
import mlreportgen.ppt.*
ppt = Presentation("myRowSpanBorder.pptx");
open(ppt);
Add a slide to the presentation.
slide = add(ppt,"Title and Table");Create a table that has two columns.
t = Table(2);
t.Style = [t.Style {VAlign("middleCentered")}];
Create the first row of the table.
tr1 = TableRow();
Create the first entry of the first row and specify that the entry spans two rows. Specify that the right border of the entry is red. Append the entry to the row.
te11 = TableEntry("entry 1,1");
te11.RowSpan = 2;
border = Border();
border.RightColor = 'red';
te11.Style = [te11.Style {border}];
append(tr1,te11);
Create the second entry of the first row and append the entry to the row. The left border of this entry is determined by the right border of the row one, column one entry.
te12 = TableEntry("entry 1,2");
append(tr1,te12);
Create the second entry of the second row, specify that the left border is red, and append the entry to the row.
tr2 = TableRow();
te22 = TableEntry("entry 2,2");
b = Border();
b.LeftColor = 'red';
te22.Style = [te22.Style {b}];
append(tr2,te22);
Append the rows to the table.
append(t,tr1);
append(t,tr2);
Add a title and the table to the slide.
replace(slide,"Title","Table Entry That Spans Multiple Rows");
replace(slide,"Table",t);
Close and view the presentation.
close(ppt);
rptview(ppt);
The right border of the first column entry is red along the entire span.