Log, Navigate, and Plot Simulation Data
This example shows the basic workflow for logging simulation data for the whole model and then navigating and plotting the logged data using Simscape™ Results Explorer.
Open the Permanent Magnet DC Motor example model. At the MATLAB® command prompt, enter:
openExample('simscape/PermanentMagnetDCMotorExample')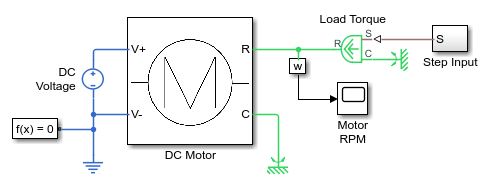
Open the Configuration Parameters dialog box and then, in the left pane, select Simscape. You can see that this example model already has data logging for the whole model enabled, as well as simulation statistics, and that the workspace variable name is
simlog_PermanentMagnetDCMotor. Select the Open viewer after simulation check box and click OK.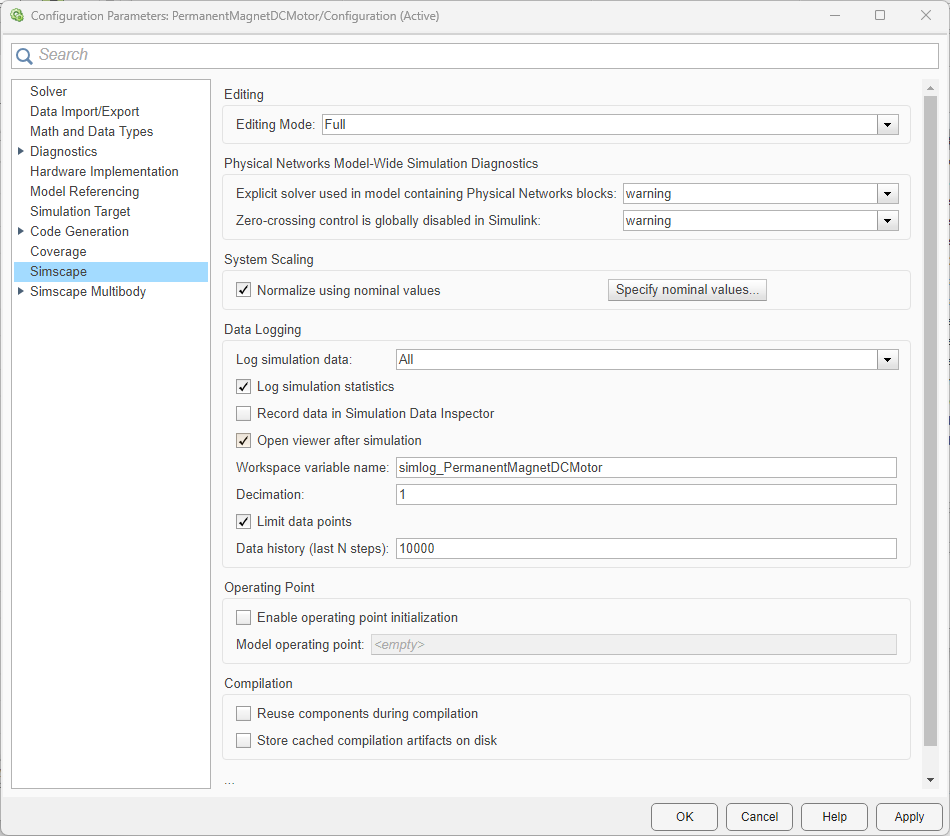
Simulate the model. When the simulation is done, the Simscape Results Explorer window opens. In the left pane, it contains the simulation log tree hierarchy, which corresponds to the model hierarchy.
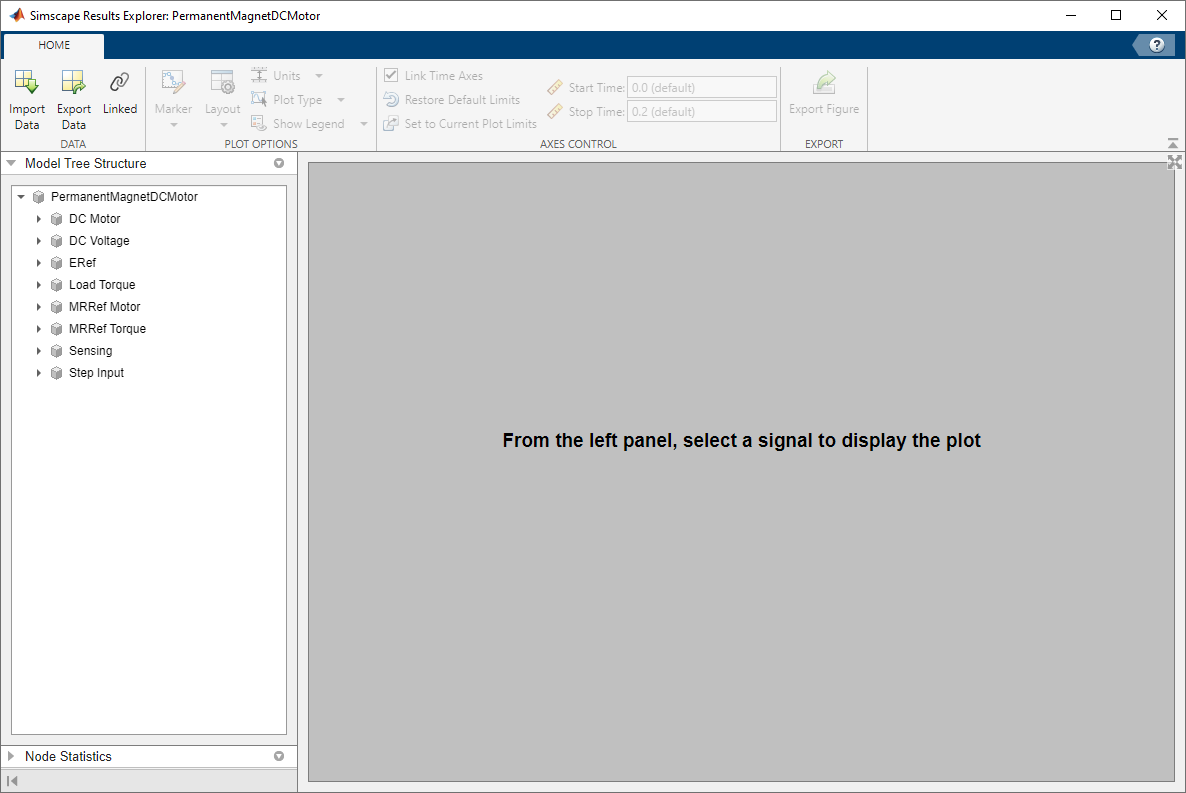
When you click a node in the left pane, the corresponding plots appear in the right pane. Expand the
DC Motornode, and then click theRotational Electromechanical Converternode to see all the node plots for this block.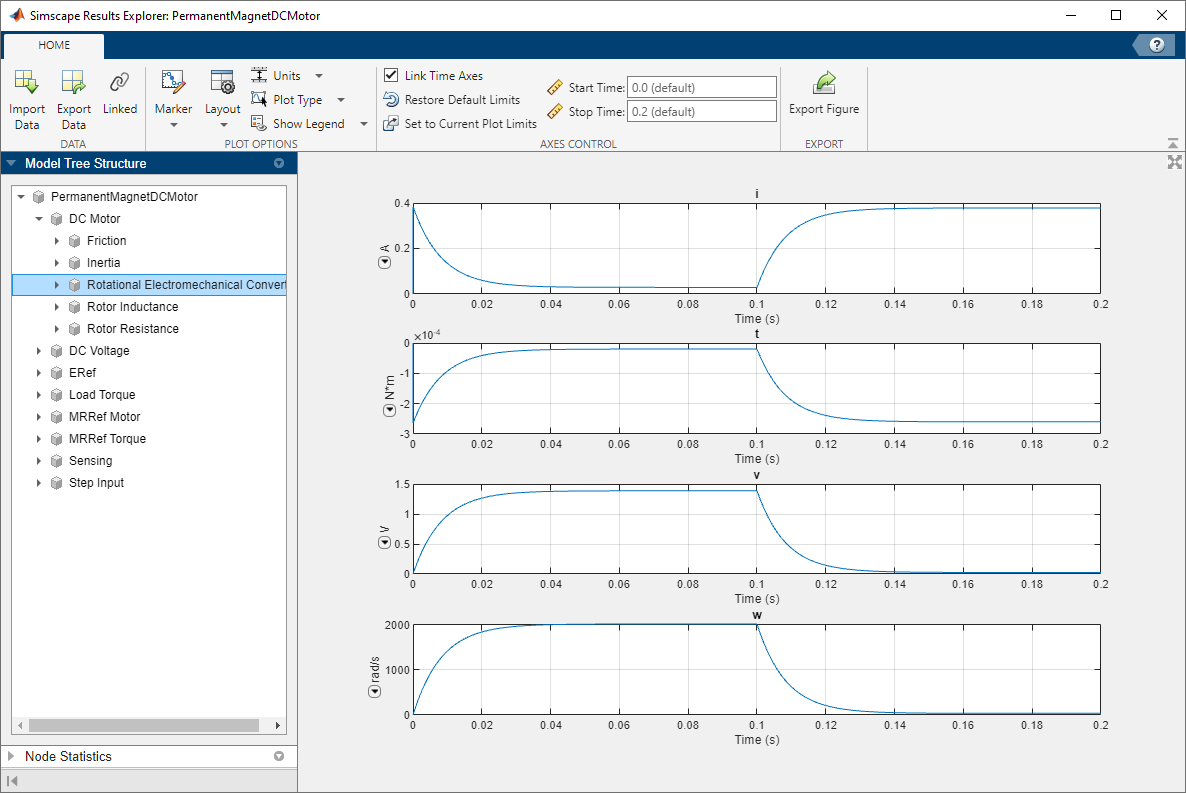
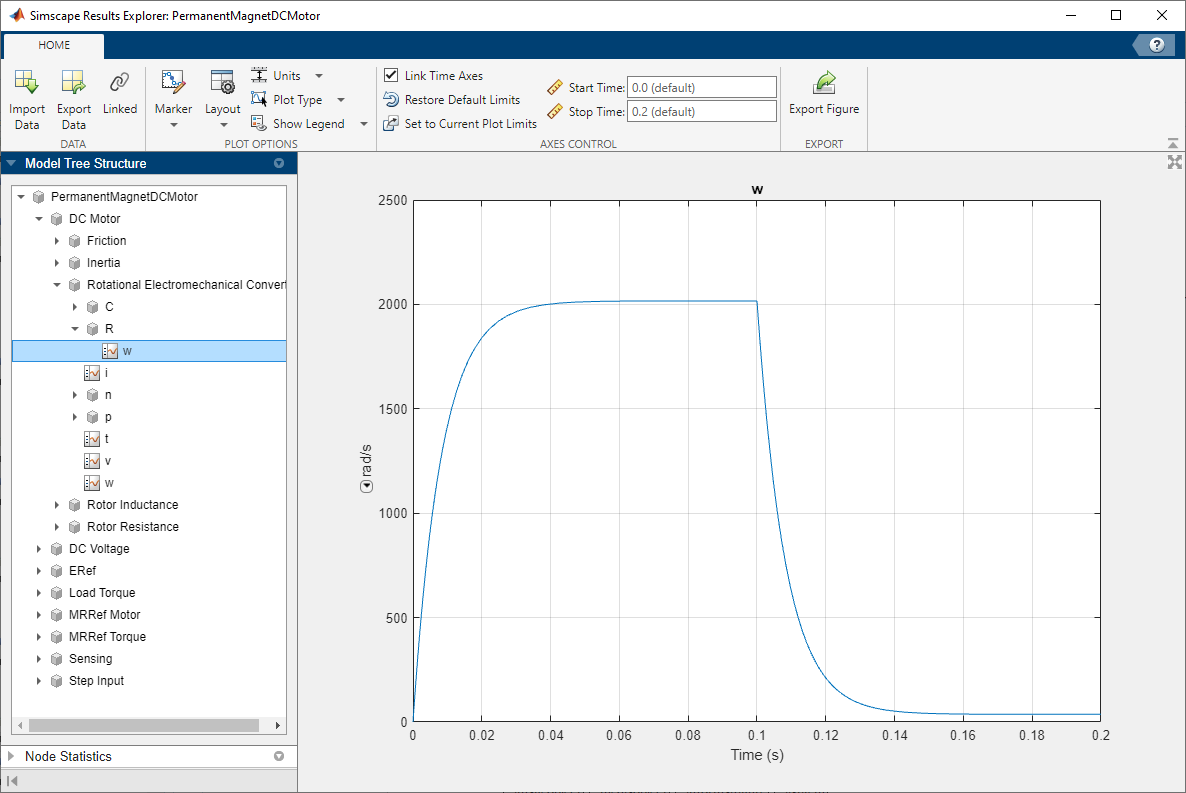
To isolate the plot of the rotor angular velocity series against time, keep expanding the nodes in the left pane until you get to the series data.
See Also
Simscape Results
Explorer | sscexplore