Circular Gauge
Display signal value during simulation on circular gauge with customizable appearance
Libraries:
Simulink /
Dashboard /
Customizable Blocks
Alternative Configurations of Circular Gauge Block:
Half Gauge | Quarter Gauge
Description
During simulation, the Circular Gauge block displays the value of the connected signal on a circular gauge that you can design to look like a gauge in a real system. You can modify the range and tick values on the Circular Gauge block to fit your data. Use the Circular Gauge block with other dashboard blocks to build an interactive dashboard of controls and indicators for your model.
Customize Circular Gauge Blocks
When you add a Circular Gauge block to your model, the block is preconfigured with a default design. You can use the block with the default design or customize the appearance of the block.
To customize the appearance of the block, use design mode. After selecting the block, you can enter design mode in one of three ways:
In the Simulink® Toolstrip, on the block-specific tab, under Design, click Edit.
In the Property Inspector, on the Design tab, click Edit.
Pause on the ellipsis that appears over the block and click the Edit Custom Block button
 .
.
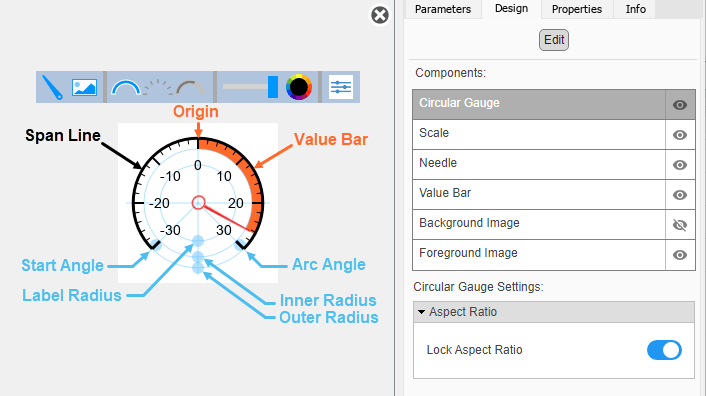
In design mode, you can use the toolbar above the block to customize the circular gauge. To access additional customization options or to enter exact values for design settings, use the Design tab in the Property Inspector.
Design Mode Actions
| Action | Available in Toolbar | Available in Design Tab |
|---|---|---|
Upload a needle image. | Yes | Yes |
Upload a background image. | Yes | Yes |
Set a solid background color. | No | Yes |
Upload a foreground image. | No | Yes |
Change the arc length of the scale. | No | Yes |
Specify the location of the origin from which the value bar grows. | No | Yes |
Change the color and opacity of the scale tick marks, scale labels, or value bar. | Yes | Yes |
Specify the scale direction as clockwise or counterclockwise. | No | Yes |
Change the size of the scale and needle. | No | Yes |
Change the position the scale and needle. | No | Yes |
To change the color and opacity of the scale tick marks, scale labels, or value bar using the toolbar, in the second section of the toolbar from the left, select the component whose color you want to change. To change the color, click the color wheel. To change the opacity, move the slider.
In addition to customizing the block design using the toolbar and Design tab, you can also resize and reposition components interactively in the canvas. The movement of the needle is limited to the line that passes through the center of the block and the minimum value on the scale.
When you finish editing the design, to exit design mode, click the X in the upper right of the canvas.
Connect Dashboard Blocks
Dashboard blocks do not use ports to connect to model elements. To connect a dashboard block,
use connect mode. To enter connect mode on an unconnected block, pause on the block you want
to connect and click the Connect button ![]() . To enter connect mode on a connected block, select the
block, pause on the ellipsis that appears (…), and in the action menu that expands, click
the Connect button.
. To enter connect mode on a connected block, select the
block, pause on the ellipsis that appears (…), and in the action menu that expands, click
the Connect button.
To connect a display block to a signal in your model or change the connection of a display
block, enter connect mode. Select the signal line to which you want to connect. From the
list that appears, select the signal to which you want to connect. Then, pause on the
dashboard block and click the Done Connecting button ![]() . To see the dashboard block display the value of the
connected block, run the simulation.
. To see the dashboard block display the value of the
connected block, run the simulation.
For more information about connecting dashboard blocks, see Connect Dashboard Blocks to Simulink Model.
You can also connect dashboard blocks to a Stateflow® chart. For more information, see Connect Dashboard Blocks to Stateflow (Stateflow).
This animation shows how to connect the Circular Gauge block to your model.
Examples
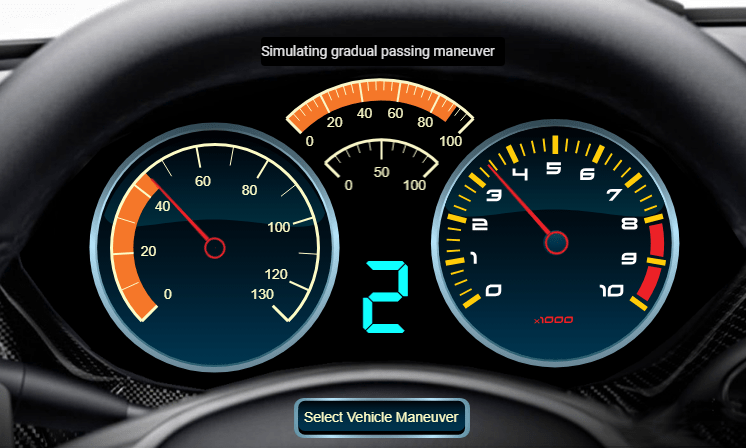
Create a Realistic Dashboard Using Blocks from the Customizable Blocks Library
Use the Circular Gauge and Display blocks to create a realistic dashboard for your model.

Design Custom Gauges
Design gauges using the Circular Gauge, Horizontal Gauge, and Vertical Gauge blocks.
Limitations
Except for the Dashboard Scope block and the Display block, dashboard blocks can only connect to real scalar signals.
You cannot use the Connection table in the Block Parameters dialog box to connect a dashboard block to a block that is commented out. When you connect a dashboard block to a commented block using connect mode, the dashboard block does not display the connected value until the you uncomment the block.
Dashboard blocks cannot connect to model elements inside referenced models.
When you simulate a model hierarchy, dashboard blocks inside referenced models do not update.
Dashboard blocks do not support rapid accelerator simulation.
During simulation, you cannot connect a dashboard block to Stateflow chart data or state activity.
You cannot programmatically connect a dashboard block to Stateflow chart data or state activity.
Some signals do not have data available during simulation due to block reduction or optimization for accelerator mode simulations. To view such a signal using a dashboard block, mark the signal for logging.
Parameters
Use the Property Inspector and the Block Parameters dialog box to specify the values of the block parameters. To set the core parameters of the dashboard block, use the Block Parameters dialog box or the Parameters tab in the Property Inspector. To customize the block, use the Design tab in the Property Inspector. To open the Block Parameters dialog box for a block, double-click the block. To open the Property Inspector, on the Modeling tab, under Design, select Property Inspector.
Parameters Tab of Property Inspector
To set the core parameters of the dashboard block, open the Property Inspector and click the Parameters tab.
Signal
This block is a display block — a block that displays a signal value. Connect the block to the signal you want to display.
Dashboard blocks do not use ports to connect to model elements. To connect a dashboard block, use connect mode, the Simulink Toolstrip, or the Connection table in the Block Parameters dialog box. For information, see Connect Dashboard Blocks to Simulink Model.
To connect to a signal using Connection table:
Select the block.
In the Property Inspector, on the Parameters tab, click Connect or Change.
Select the signal line to whose signal you want to connect.
In the table that appears, select the signal.
Click Apply.
You can also connect dashboard blocks to a Stateflow chart. For more information, see Connect Dashboard Blocks to Stateflow (Stateflow).
Programmatic Use
You can programmatically connect a display block to a signal. Define a Simulink.HMI.SignalSpecification
object that represents the signal. Then, set the value of the
Binding parameter to the object. To set the value of the
Binding parameter, use the set_param function.
For example, suppose the model named vdp contains a
Circular Gauge block named myGauge and a
signal named x1. To connect the block to the signal, use this
code.
blockPath = "vdp/myGauge";
signalPath = "vdp/x1";

myObj = Simulink.HMI.SignalSpecification;
myObj.BlockPath = Simulink.BlockPath(signalPath);

set_param(blockPath,Binding=myObj)
| Parameter: | Binding |
| Values: | Simulink.HMI.SignalSpecification object |
Example: set_param(gcb,Binding=myObj)
Main
Finite, real, double, scalar value specifying the minimum tick mark value for the scale. The parameter value must be less than the value of the Maximum parameter.
Programmatic Use
To set the block parameter value programmatically, use
the set_param function.
Specify the value of the Limits parameter as a vector of the
form [min,int,max].
minis theMinimumtick mark value of the scale.intis theTick Intervalof the scale. To use theautovalue for theTick Interval, leave theTick Intervalposition in the vector empty, or specify-1.maxis theMaximumtick mark value of the scale.
| Parameter: | Limits |
| Values: | [0 -1 100] (default) | [min,int,max] |
Example: set_param(gcb,Limits=[-50 -1 100])
Finite, real, double, scalar value specifying the maximum tick mark value for the scale. The parameter value must be greater than the value of the Minimum parameter.
Programmatic Use
To set the block parameter value programmatically, use
the set_param function.
Specify the value of the Limits parameter as a vector of the
form [min,int,max].
minis theMinimumtick mark value of the scale.intis theTick Intervalof the scale. To use theautovalue for theTick Interval, leave theTick Intervalposition in the vector empty, or specify-1.maxis theMaximumtick mark value of the scale.
| Parameter: | Limits |
| Values: | [0 -1 100] (default) | [min,int,max] |
Example: set_param(gcb,Limits=[0 -1 50])
Finite, real, positive, whole, scalar value specifying the interval of major tick
marks on the scale. When set to auto, the block automatically adjusts
the tick interval based on the values of the Maximum and
Minimum parameters.
Programmatic Use
To set the block parameter value programmatically, use
the set_param function.
Specify the value of the Limits parameter as a vector of the
form [min,int,max].
minis theMinimumtick mark value of the scale.intis theTick Intervalof the scale. To use theautovalue for theTick Interval, leave theTick Intervalposition in the vector empty, or specify-1.maxis theMaximumtick mark value of the scale.
| Parameter: | Limits |
| Values: | [0 -1 100] (default) | [min,int,max] |
Example: set_param(gcb,Limits=[0 5 100])
Set the direction of increasing scale values.
Programmatic Use
To set the block parameter value programmatically, use
the set_param function.
| Parameter: | ScaleDirection |
| Values: | 'Clockwise' (default) | "Clockwise" | "Counterclockwise" |
Example: set_param(gcb,ScaleDirection="Counterclockwise")
You can display the name of the element to which the dashboard block connects in a
label positioned at the top or bottom of the block, or you can hide the label. If you
want the label to be visible, specify the position of the label. If you do not want the
label to be visible, select Hide.
Note
When the dashboard block is not connected to an element, the label is blank.
Programmatic Use
To set the block parameter value programmatically, use
the set_param function.
| Parameter: | LabelPosition |
| Values: | 'Hide' (default) | "Hide" | "Bottom" | "Top" |
Example: set_param(gcb,LabelPosition="Top")
Select this parameter to maintain the aspect ratio when resizing the block in the Simulink canvas.
When the aspect ratio is locked, adding a new background image changes the aspect ratio of the block to match the aspect ratio of the background image. When the aspect ratio is unlocked, adding a new background image does not change the aspect ratio of the block, but instead changes the aspect ratio of the background image to fit the size of the block.
When the aspect ratio is locked, pressing the Shift key while resizing a block temporarily unlocks the aspect ratio. When you release the Shift key, the aspect ratio locks. When the aspect ratio is unlocked, pressing the Shift key while resizing a block temporarily locks the aspect ratio. When you release the Shift key, the aspect ratio unlocks.
Color specifications for value ranges on the scale. Click the + button to add a scale color. For each color added, specify the minimum and maximum values of the range in which you want to display that color.
Programmatic Use
To set the block parameter value programmatically, use
the set_param function.
Specify the value of the ScaleColors parameter as an array of
structures, one structure for each color range you want to define. Each structure
has these fields:
Min— Minimum value for the color range on the scaleMax— Maximum value for the color range on the scaleColor—1-by-3[r g b]vector with values between0and1
For example, this code specifies colors for two value ranges. From
0 to 50, the code adds a blue scale color,
and from 50 to 100, the code adds a green
scale color.
range1.Min = 0;
range1.Max = 50;
range1.Color = [0 0 1];
range2.Min = 50;
range2.Max = 100;
range2.Color = [0 1 0];
scaleRanges = [range1 range2];

set_param(gcb,ScaleColors=scaleRanges)| Parameter: | ScaleColors |
| Values: | N-by-1 struct array, where
N is the number of color ranges and each struct has
the fields Min, Max, and
Color |
Example: set_param(gcb,ScaleColors=scaleRanges)
Design Tab of Property Inspector
To customize the dashboard block, open the Property Inspector, click the Design tab, and click Edit.
Circular Gauge
Select this parameter to maintain the aspect ratio when resizing the block in the Simulink canvas.
When the aspect ratio is locked, adding a new background image changes the aspect ratio of the block to match that of the background image. When the aspect ratio is unlocked, adding a new background image does not change the proportions of the block but instead stretches or scales the background image to fit the size of the block.
When the aspect ratio is locked, pressing the Shift key while resizing a block unlocks the aspect ratio. When you release the Shift key, the aspect ratio locks. When the aspect ratio is unlocked, pressing the Shift key while resizing a block locks the aspect ratio. When you release the Shift key, the aspect ratio unlocks.
Scale
Finite, real, double, scalar value specifying the minimum tick mark value for the scale. The parameter value must be less than the value of the Maximum parameter.
Programmatic Use
To set the block parameter value programmatically, use
the set_param function.
Specify the value of the Limits parameter as a vector of the form
[min,int,max].
minis theMinimumtick mark value of the scale.intis theTick Intervalof the scale. To use theautovalue for theTick Interval, leave theTick Intervalposition in the vector empty, or specify-1.maxis theMaximumtick mark value of the scale.
| Parameter: | Limits |
| Values: | [0 -1 100] (default) | [min,int,max] |
Example: set_param(gcb,Limits=[-50 -1 100])
Finite, real, double, scalar value specifying the maximum tick mark value for the scale. The parameter value must be greater than the value of the Minimum parameter.
Programmatic Use
To set the block parameter value programmatically, use
the set_param function.
Specify the value of the Limits parameter as a vector of the
form [min,int,max].
minis theMinimumtick mark value of the scale.intis theTick Intervalof the scale. To use theautovalue for theTick Interval, leave theTick Intervalposition in the vector empty, or specify-1.maxis theMaximumtick mark value of the scale.
| Parameter: | Limits |
| Values: | [0 -1 100] (default) | [min,int,max] |
Example: set_param(gcb,Limits=[0 -1 50])
Finite, real, positive, whole, scalar value specifying the interval of major tick marks on the scale. When set to auto, the block automatically adjusts the tick interval based on the values of the Maximum and Minimum parameters.
Programmatic Use
To set the block parameter value programmatically, use
the set_param function.
Specify the value of the Limits parameter as a vector of the
form [min,int,max].
minis theMinimumtick mark value of the scale.intis theTick Intervalof the scale. To use theautovalue for theTick Interval, leave theTick Intervalposition in the vector empty, or specify-1.maxis theMaximumtick mark value of the scale.
| Parameter: | Limits |
| Values: | [0 -1 100] (default) | [min,int,max] |
Example: set_param(gcb,Limits=[0 5 100])
Specify the value on the scale from which the needle moves and the value bar grows.
When set to auto, the Origin is the minimum of
the scale.
Set the direction of increasing scale values.
Programmatic Use
To set the block parameter value programmatically, use
the set_param function.
| Parameter: | ScaleDirection |
| Values: | 'Clockwise' (default) | "Clockwise" | "Counterclockwise" |
Example: set_param(gcb,ScaleDirection="Counterclockwise")
Specify the arc length of the scale as a scalar value, measured in degrees.
Specify the angular location of the minimum scale value, measured in degrees clockwise from the horizontal axis pointing right.
Specify the radius of the free end of the scale tick marks as a ratio of the
smaller of the two dimensions of the bounding box of the scale, width or
height. The Inner Radius can be larger than the
Outer Radius.
Specify the span line radius as a ratio of the smaller of the two dimensions
of the bounding box of the scale, width or height. The Outer
Radius can be smaller than the Inner
Radius.
Specify the horizontal offset of the left edge of the bounding box of
the scale from the left edge of the block as a ratio of the
block width. Relative to the position of the scale when the
offset is 0, an offset with a negative value
moves the scale left, and an offset with a positive value moves
the scale right.
Specify the vertical offset of the top edge of the bounding box of the scale from the
top edge of the block as a ratio of the block height. Relative to the position of the
scale when the offset is 0, an offset with a negative value moves the
scale up, and an offset with a positive value moves the scale down.
Specify the width of the bounding box of the scale as a ratio of the block width.
Specify the height of the bounding box of the scale as a ratio of the block height.
Select this parameter to maintain the aspect ratio when resizing the scale using the Property Inspector.
Set the color of the scale tick marks, the span line, and the block name. Choose a color from the palette of standard colors, or specify a custom color.
Tip
You can also set the Tick Color by choosing a Foreground Color on the Format tab of the Simulink Toolstrip.
To specify the color of the block text, use the Label Color parameter.
Programmatic Use
To set the block parameter value programmatically, use
the set_param function.
| Parameter: | ForegroundColor |
| Values: | [r g b] vector with values between
0 and 1 formatted as a string or
character vector |
Example: set_param(gcb,ForegroundColor="[1 0
1]")
Specify the height of the minor tick marks on the scale as a ratio of the height to the difference between the outer and inner radii.
Choose a font color for the scale label from the palette of standard colors, or specify a custom color.
Example: [1 1 0.5]
Tip
To specify the color of the scale, use the Tick Color parameter.
Specify the distance of the scale labels from the center of the scale as a ratio of the radius of the scale.
Needle
Specify the width of the needle image as a ratio of the smaller of the two dimensions of the bounding box of the scale, width or length.
Specify the height of the needle image as a ratio of the smaller of the two dimensions of the bounding box of the scale, width or length.
Select this parameter to maintain the aspect ratio when resizing the image using the Property Inspector.
Rotate the needle image about its center in 90 degree increments.
Specify the distance from the center of the needle image to the center of the scale as a ratio of the diameter of the scale.
Background Image
For the block background, you can provide a background image or select a solid color. To select a solid background color, turn Use Background Color on. To provide a background image, turn Use Background Color off.
Note
Changing the background color using the toolstrip removes the background image and enables the Use Background Color option.
When you use a solid background with the Circular Gauge block, you can design noncircular gauges. When the scale arc angle is 180° or smaller, the background shape conforms to the scale.

To select a solid background color, enable the Use Background Color parameter. Then, choose a background color from the palette of standard colors, or specify a custom color.
Note
When you use a solid background with the Circular Gauge block, you can design noncircular gauges. When the scale arc angle is 180° or smaller, the background shape conforms to the scale.
Programmatic Use
To set the block parameter value programmatically, use
the set_param function.
| Parameter: | BackgroundColor |
| Values: | [r g b] vector with values between 0
and 1 formatted as a string or character vector |
Example: set_param(gcb,BackgroundColor="[1 0
1]")
Specify the block background opacity as a scalar value from 0 to
1.
Specify the offset of the outer edge of the area covered by the block background
color from tick marks as a scalar value from 0 to
1.
Foreground Image
Specify the horizontal offset of the left edge of the image from the left edge of the
block as a ratio of the block width. Relative to the position of the image when the
offset is 0, an offset with a negative value moves the image left,
and an offset with a positive value moves the image right.
Specify the vertical offset of the top edge of the image from the top edge of the
block as a ratio of the block height. Relative to the position of the image when the
offset is 0, an offset with a negative value moves the image up, and
a positive value moves the image down.
Specify the width of the foreground image as a ratio of the block width.
Specify the height of the foreground image as a ratio of the block height.
Select this parameter to maintain the aspect ratio when resizing the image using the Property Inspector.
Block Characteristics
Data Types |
|
Direct Feedthrough |
|
Multidimensional Signals |
|
Variable-Size Signals |
|
Zero-Crossing Detection |
|
Alternative Configurations
Extended Capabilities
Version History
Introduced in R2020bStarting in R2023b, you can open a dashboard panel in a new window. To do so, select the
panel and pause on the ellipsis that appears. In the action menu that expands, click Open In
New Window ![]() .
.
You can minimize and restore the new window containing the panel separately from the model window. From the panel window, you can run, pause, stop, and step through the simulation. In the panel window, you can edit the panel and the blocks it contains.
To return the panel to the model canvas, in the panel window toolstrip, click Open in
canvas ![]() .
.
For more information about opening a panel in a new window, see Open Panels in New Window.