View Sample Time Information
R2026bSimulink® models can display color coding and annotations that represent specific sample times. You can display the blocks and signal lines in color. The annotations are badges on the output ports on the blocks and are colored in black:
To enable colors, in the Simulink model window, on the Debug tab, select Information Overlays > Colors.
To enable annotations, on the Debug tab, select Information Overlays > Text.
Selecting both Colors and Text displays both the colors and the annotations. Regardless of your choice, Simulink performs an Update Model automatically.
To turn off the colors and annotations:
On the Debug tab, select Information Overlays > Colors to disable colors.
On the Debug tab, select Information Overlays > Text to disable annotations.
When you change these settings, the software automatically performs Update Diagram.
Your sample time display choices directly control the information that the Timing Legend displays.
Note
The discrete sample times in the table Designations of Sample Time Information represent a special case. Five colors indicate the speed through the fifth fastest discrete rate. A sixth color, orange, represents all rates that are slower than the fifth discrete rate. You can distinguish between these slower rates by looking at the annotations on their respective signal lines.
Inspect Sample Time Using Timing Legend
You can view the Timing Legend for an individual model or for multiple models. Additionally, you can prevent the legend from automatically opening when you select options on the Sample Time menu.
To assist you with interpreting a block diagram, the Timing Legend contains the sample time color, annotation, and value for each sample time in the model. To view the legend:
In the Simulink model window, on the Modeling tab, click Update Model.
On the Debug tab, select Information Overlays > Legend, or press Ctrl+J.
You can also use the shortcut on the Explorer Bar on the left side of the Simulink Editor.
Three colors indicate the three fastest discrete sample times. The third color, blue, represents all rates that are slower than the third discrete sample time. The sample time colors can be customized to have more colors for discrete sample times.
In addition, when you select Colors or Text, the software updates the model diagram and opens the legend by default. The legend contents reflect your choices. If you turn colors on, the legend displays the color and the value of the sample time. If you turn annotations on, the annotations appear in the legend.
The legend displays sample times present in the model, classified by the type of the sample time. To avoid clutter, the timing information is displayed in rows that expand to show more information about each specific sample time. You can expand each row to learn how that specific sample time is introduced in the model. Check boxes for sample times also allow you to choose specific sample times to display. The Timing Legend also displays the base rate and scalar multipliers for analysis of the discrete time-lines.
For discrete sample time, the Time/Freq toggle button allows you to choose the format of the multiplier information. All discrete sample times are combined into the same row, for example, periodic partitions, discrete export function etc. Triggered sample time rates are now visualized as their source sample times, illustrating the sample rate that drives the trigger. Annotations for aperiodic partition, reset, initialize, reinitialize, and terminate sample times do not use their event names as annotations but instead have their own concise annotations.
The Timing Legend allows you to highlight the blocks and signals in the model that the sample time originates from. Expand a sample time row, and then click the hyperlink to navigate to the block in the model.
Note
The Timing Legend displays all of the sample times in the model, including those that are not associated with any block. For example, if the fixed step size is 0.1 and all blocks have a sample time of 0.2, then both sample times (0.1 and 0.2) appear in the legend.
You do not need to update your model when you change the sample time visualization options or when you open the Timing Legend after compiling the model. (since R2023b)
If you do not want to view the legend upon selecting Sample Time Display:
In the Simulink Toolstrip, on the Modeling tab, select Environment > Simulink Settings.
In the General pane, clear Open the timing legend when the sample time display is changed and click Apply.
Visualize Sample Time Across Model Hierarchies
When working with model reference hierarchies, Simulink keeps sample-time colors, annotations, and timing-legend information consistent across the entire model hierarchy. This synchronization interprets timing behavior without reconfiguring each referenced model individually.
Top Model Determines Visualization
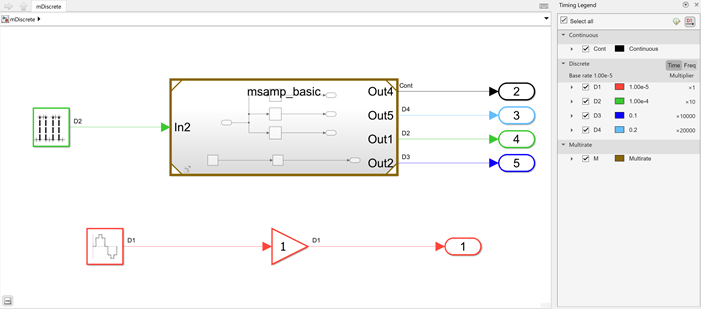
The top model mDiscrete defines the sample time
visualization for the entire hierarchy. When you toggle the colors, text, or
timing legend in any model window, Simulink updates the visualization settings of the top model and refreshes
the entire hierarchy.
This image shows the sample-time colors, annotations, and rate labels that originate from the compiled rate of the model. The referenced model inherits these visualization settings when opened in the context of the model hierarchy.
Sample-Time Mappings
Referenced models may contain explicitly scheduled sample times or inherit sample times from the top model. During compilation, Simulink analyzes sample-time mappings between the top and referenced models. These mappings determine how each referenced-model rate corresponds to the top-model rates. Referenced models are displayed using the top model's timing context.
The Timing Legend includes a Display Source widget that indicates whether the displayed sample time colors come from the top model or the referenced model.
How a referenced model appears depends on how you open it.
Open in Context. To open a referenced model in the context of the current model hierarchy, double-click the corresponding Model block. Alternatively, right-click the Model block and select Open in New Tab or Open in New Window.
When you open the model this way, the model inherits the top model's sample time colors and annotations. This video demonstrates this way of opening the referenced model.
Open Outside of Model Hierarchy. To open a referenced model outside of the current model hierarchy, on the
Model block icon, click  . Alternatively, right-click the
Model block and select Open as Top
Model.
. Alternatively, right-click the
Model block and select Open as Top
Model.
When you open msamp_basic this way, Simulink compiles it independently. To display sample-time colors and
annotations, toggle them explicitly in the new window. The Timing
Legend reflects the intrinsic base rate and rate ordering of
msamp_basic. In this view, the rate labels and colors
do not map to the timing context of mDiscrete.
When Synchronization Does Not Apply
Synchronized sample-time visualization is supported when the software can map the sample times between the top model and referenced models in a meaningful way. When the software cannot map the execution rates, the reference model shows its own timing context. In this case, sample-time colors, annotations, and the timing legend might differ from those in the top model.
For example, in this video, the top model schedules the referenced model using
periodic event ports. The Model block is displayed using the top
model's timing context and appears as rate D2. When you open
the referenced model, the software displays the model using its own timing
context instead of the top model's. The Display Source
widget indicates that the sample-time colors, annotations, and timing legend are
derived from the referenced model.
Customize Sample Time Colors
You can customize sample time color palette using the simulink.sampletimecolors.Palette object and its functions. You can
create a customized color palette object for all types of sample times in your
model. You can then use this palette for your current MATLAB® session, or make it a default color palette for all your MATLAB sessions.
Create Custom Sample Time Color Palette to Use as Default
Create a custom color palette object with the name
myFirstPalette.pltObj = simulink.sampletimecolors.Palette("myFirstPalette");Palette with properties: Name: "myFirstPalette" ContinuousSampleTimeColors: [0 0 0] FixedInMinorStepSampleTimeColors: [0.4902 0.4902 0.4902] ContinuousVariableSampleTimeColors: [0.4902 0.4902 0.4902] DiscreteSampleTimeColors: [3x3 double] AsynchronousSampleTimeColors: [0.7529 0.3608 0.9843] AperiodicPartitionColors: [0.7529 0.3608 0.9843] InitializeEventSampleTimeColors: [0.7961 0.5176 0.3647] TerminateEventSampleTimeColors: [0.7961 0.5176 0.3647] ResetEventSampleTimeColors: [0.7961 0.5176 0.3647] ReinitializeEventSampleTimeColors: [0.7961 0.5176 0.3647] ConstantSampleTimeColors: [0.8196 0.0157 0.5451] MultirateSampleTimeColors: [0.5451 0.4000 0.0235] UnionSampleTimeColors: [0.4039 0.2980 0.0235]Customize colors for the continuous sample time using RGB values.
pltObj.ContinuousSampleTimeColors = [0.9 0.2 0.4];
Customize colors for discrete sample time. This step shows different ways to set the colors for sample times.
Use hexadecimal codes to customize colors.
pltObj.DiscreteSampleTimeColors = ["#123456", "#523467", "#204973"];
Use predefined MATLAB colormaps, for example,
parula. For more information, see Change Color Scheme Using a Colormap.pltObj.DiscreteSampleTimeColors = parula(3);
A model with sample time colors set to
parula: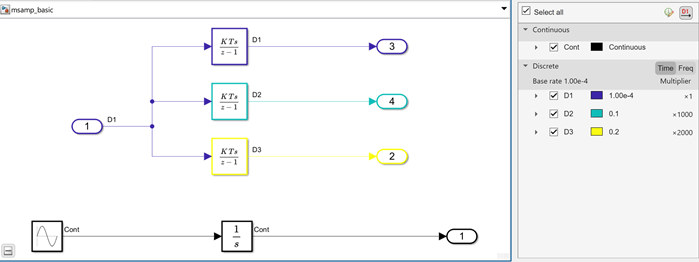
Use the pre-configured built-in classic color palette to customize sample time colors:
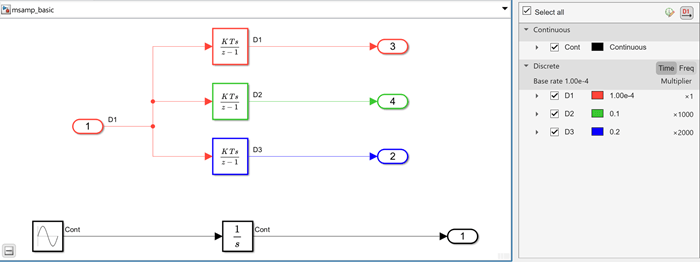
simulink.sampletimecolors.applyPalette("classic (built in)")A model with sample time colors set to
classic (built
                                        in)
:
Use the pre-configured built-in color blind color palette to customize sample time colors:
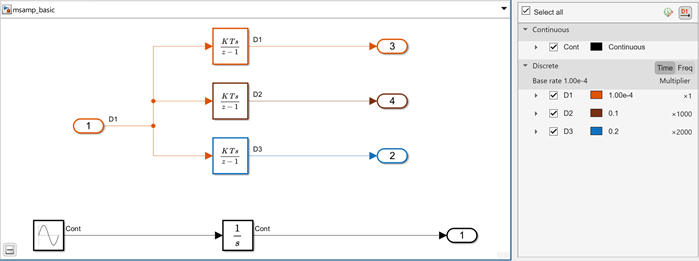
simulink.sampletimecolors.applyPalette("color blind accessible (built in)")A model with sample time colors set to
color blind
                                        accessible (built in)
:
Set the new custom color palette as a default palette for the current and all future MATLAB sessions.
To see the new color palette for sample times in your Simulink model, press Ctrl+D to update the model.simulink.sampletimecolors.applyPalette(pltObj,"UserDefault",true)
Inspect Sample Times Throughout Model
The Model Data Editor shows information about model data such as
signals, parameters, and states, in a sortable, searchable table. To open the
Model Data Editor, on the Modeling tab, click
Model Data Editor. The Sample Time
column shows the sample time specified for each signal in a model. After you update
the block diagram, the column also shows the specific sample that each signal uses.
For example, for signals for which you specify inherited sample time, the column
shows -1. You can also use this column to specify sample times.
For more information, see Model Data Editor.
See Also
Objects
Functions
simulink.sampletimecolors.applyPalette|simulink.sampletimecolors.getPalette|simulink.sampletimecolors.removePalette|simulink.sampletimecolors.storePalette

