Prototype and Debug Models with Scopes
Simulink® Scope blocks and viewers offer a quick and lightweight way to visualize your simulation data over time. If you are prototyping a model design, you can attach signals to a Scope block. After simulating the model, you can use the results to validate your design. See Scope Blocks and Scope Viewer Overview.
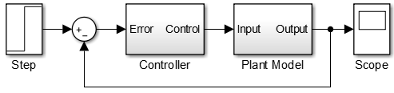
A Scope block or Scope viewer opens to a Scope window where you can display and evaluate simulation data.
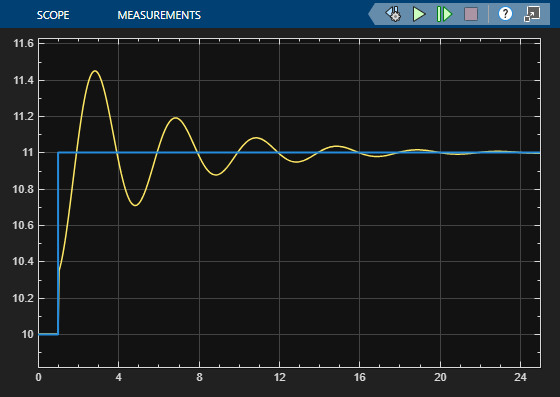
The toolbar contains controls for starting, stopping, and stepping forward through a
simulation ![]() . You can use these controls to debug a model by
viewing signal data at each time interval. See How Stepping Through Simulations Works.
. You can use these controls to debug a model by
viewing signal data at each time interval. See How Stepping Through Simulations Works.
Connect signal lines to a Scope block using multiple input ports.
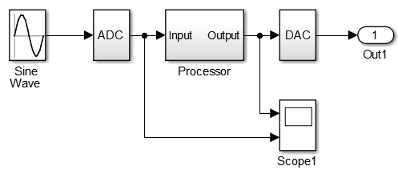
Attach signals to a Floating Scope block or signal viewer directly from the model. See Add Signals to Existing Floating Scope or Scope Viewer.

Use the oscilloscope-like tools available with a scope to debug your model. Set triggers to capture events, use interactive cursors to measure signal values at various points, and review signal statistics such as maximum and mean values. See Scope Triggers and Cursor Measurements.

Save or log signal data to the MATLAB® workspace, and then plot data in a MATLAB figure window. Use MATLAB functions or your own scripts to analyze the data. See Save Simulation Data from Floating Scope.

See Also
Floating Scope | Scope | Scope Viewer