Kinetic Energy Recovery System
This example shows operation of a Kinetic Energy Recovery System (KERS) on a Formula 1 car. The model permits the benefits to be explored. During braking, energy is stored in a lithium-ion battery and ultracapacitor combination. It is assumed that a maximum of 400KJ of energy is to be delivered in one lap at a maximum power of 60KW. Design parameters are the weight of the battery, ultracapacitor and motor-generator. If these parameters are all set to the very small value of 0.01kg, the lap time is 95.0 seconds, this corresponding to a car with no KERS. With default values set here, approximately 1/4 of a second is saved on the lap time when using any available electrical power when not braking. Applying KERS only to selected corners requires a larger ultracapacitor to show any significant benefit.
This model shows how Simscape™ Electrical™ and Simscape can be used to support system-level design. The KERS performance is a complex trade-off between the masses of the three main components (battery, ultracapacitor and motor-generator), plus the energy-management strategy. The KERS system adds mass which reduces acceleration due to the engine. The stored electrical energy from braking must more than compensate for this. Lithium-ion batteries have a very high energy per unit mass but a poor power per unit mass. Conversely an ultracapacitor has relatively low energy per unit mass, but a very high power per unit mass which suits this particular application.
Model

PMSM Drive Subsystem

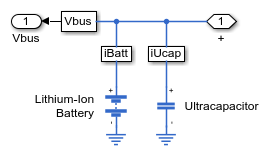
Battery and Ultracapacitor Subsystem
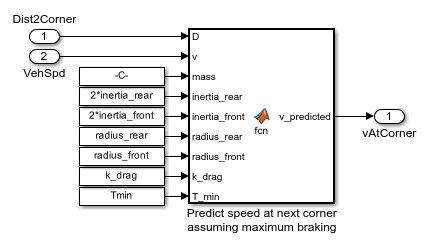
Predict Speed at Corner If Maximum Braking Used Subsystem
Simulation Results from Simscape Logging
The plot below shows the vehicle speed during a single lap. The driver knows the maximum speed the vehicle should be travelling at the corners on the track and applies the brakes to achieve that speed in the corner.

The plot below compares the two strategies for using the electrical drive during acceleration. One strategy uses the electrical powertrain during all corners, the other uses it only on selected corners. The difference is easiest to see on the plot of motor torque, where the selected corners strategy shows zero torque from the motor during a number of the corners in the lap (rapid deceleration and acceleration).

Results from Real-Time Simulation
This example has been tested on these platforms:
Speedgoat™ Performance real-time target machine with an Intel® 3.5 GHz i7 multi-core CPU and 4 GB RAM.
dSPACE® SCALEXIO LabBox with Intel® Core XEON E3-1275v3 at 3.5GHz and 4 GB RAM.
You can run this model in real time with a step size of 50 microseconds by using the Simscape local solver. For small sample rates, a task overrun might occur during the initial task execution due to a cold cache. To avoid this overrun, if the selected platform supports these options, relax the start-up behavior by specifying a limited number of task overruns or increasing the sample time of periodic tasks during the start-up phase of the real-time application.