Stateflow.op.OperatingPointData
Operating point information for chart data
Description
A Stateflow.op.OperatingPointData object contains a snapshot of a
data object in a Stateflow® chart during simulation.
Creation
When you save the final operating point for a Simulink® model, as described in Save Operating Points, you create a Stateflow.op.BlockOperatingPoint
object for each Stateflow chart in the model. This object contains a
Stateflow.op.OperatingPointData object for each:
Chart output data
Chart, state, and function local data
Persistent variable in a MATLAB® function or truth table
Access a Stateflow.op.OperatingPointData object by using the property
that matches the name of the data in the parent Stateflow.op.BlockOperatingPoint or
Stateflow.op.OperatingPointContainer. For example, suppose that
op is the Stateflow.op.BlockOperatingPoint object for a
chart. To access the Stateflow.op.OperatingPointData object for a chart
output called output, enter:
op.output
Similarly, to access the Stateflow.op.OperatingPointData object for a
persistent variable called persistentVar in the MATLAB function function, enter:
op.function.persistentVar
Properties
Object Functions
open | Display object in editing environment |
Examples
Open the model
old_sf_car.openExample("old_sf_car")Set the model to save the final operating point. Open the Configuration Parameters dialog box and, in the Data Import/Export pane:
Select Final states and enter a name for the operating point. For this example, use
xSteadyState.Select Save final operating point.
Click OK.
Set the stop time for this simulation segment. In the Simulation tab, set Stop Time to
10.Run the simulation.
Access the
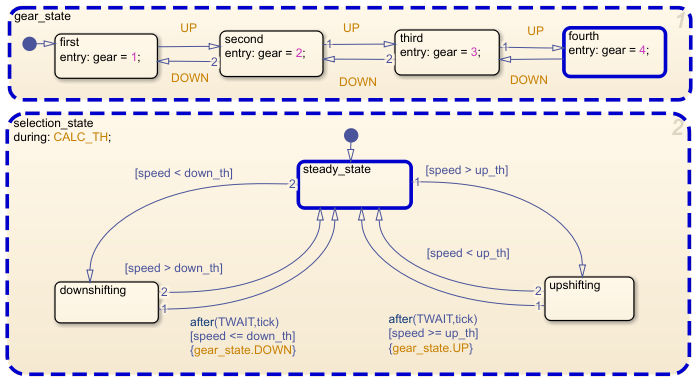
Stateflow.op.BlockOperatingPointobject that contains the operating point information for theshift_logicchart.blockpath = "old_sf_car/shift_logic"; op = get(xSteadyState,blockpath)op = Block: "shift_logic" (handle) (active) Path: old_sf_car/shift_logic Contains: + gear_state "State (AND)" (active) + selection_state "State (AND)" (active) gear "Block output data" double [1, 1]Highlight the states that are active in the chart at t = 10.
highlightActiveStates(op)
Access the
Stateflow.op.OperatingPointDataobject that contains the operating point information for the chart outputgear.op.gear
ans =

      Description: 'Block output data'
         DataType: 'double'
             Size: '[1, 1]'
            Range: [1x1 struct]
     InitialValue: [1x0 double]
            Value: 4
Change the value of
gearto1.op.gear.Value = 1;
Inspect the modified operating point information for the chart output
gear.op.gear
ans =

      Description: 'Block output data'
         DataType: 'double'
             Size: '[1, 1]'
            Range: [1x1 struct]
     InitialValue: [1x0 double]
            Value: 1