Main Content

incrementalLearner

Convert naive Bayes classification model to incremental learner

Since R2021a

Description

example

IncrementalMdl = incrementalLearner(Mdl) returns a naive Bayes classification model for incremental learning, IncrementalMdl, using the hyperparameters of the traditionally trained naive Bayes classification model Mdl. Because its property values reflect the knowledge gained from Mdl, IncrementalMdl can predict labels given new observations, and it is warm, meaning that its predictive performance is tracked.

example

IncrementalMdl = incrementalLearner(Mdl,Name,Value) uses additional options specified by one or more name-value arguments. Some options require you to train IncrementalMdl before its predictive performance is tracked. For example, 'MetricsWarmupPeriod',50,'MetricsWindowSize',100 specifies a preliminary incremental training period of 50 observations before performance metrics are tracked, and specifies processing 100 observations before updating the window performance metrics.

Examples

collapse all

Train a naive Bayes model by using fitcnb, and then convert it to an incremental learner.

Load and Preprocess Data

Load the human activity data set.

load humanactivity

For details on the data set, enter Description at the command line.

Train Naive Bayes Model

Fit a naive Bayes classification model to the entire data set.

TTMdl = fitcnb(feat,actid);

TTMdl is a ClassificationNaiveBayes model object representing a traditionally trained naive Bayes classification model.

Convert Trained Model

Convert the traditionally trained naive Bayes classification model to one suitable for incremental learning.

IncrementalMdl = incrementalLearner(TTMdl) 
IncrementalMdl = 
  incrementalClassificationNaiveBayes

                    IsWarm: 1
                   Metrics: [1x2 table]
                ClassNames: [1 2 3 4 5]
            ScoreTransform: 'none'
         DistributionNames: {1x60 cell}
    DistributionParameters: {5x60 cell}


IncrementalMdl is an incrementalClassificationNaiveBayes model object prepared for incremental learning using naive Bayes classification.

  • The incrementalLearner function initializes the incremental learner by passing learned conditional predictor distribution parameters to it, along with other information TTMdl extracts from the training data.

  • IncrementalMdl is warm (IsWarm is 1), which means that incremental learning functions can track performance metrics and make predictions.

Predict Responses

An incremental learner created from converting a traditionally trained model can generate predictions without further processing.

Predict classification scores (class posterior probabilities) for all observations using both models.

[~,ttscores] = predict(TTMdl,feat);
[~,ilcores] = predict(IncrementalMdl,feat);
compareScores = norm(ttscores - ilcores)
compareScores = 0

The difference between the scores generated by the models is 0.

Use a trained naive Bayes model to initialize an incremental learner. Prepare the incremental learner by specifying a metrics warm-up period, during which the updateMetricsAndFit function only fits the model. Specify a metrics window size of 500 observations.

Load the human activity data set.

load humanactivity

For details on the data set, enter Description at the command line.

Randomly split the data in half: the first half for training a model traditionally, and the second half for incremental learning.

n = numel(actid);

rng(1) % For reproducibility
cvp = cvpartition(n,'Holdout',0.5);
idxtt = training(cvp);
idxil = test(cvp);

% First half of data
Xtt = feat(idxtt,:);
Ytt = actid(idxtt);

% Second half of data
Xil = feat(idxil,:);
Yil = actid(idxil);

Fit a naive Bayes model to the first half of the data. Suppose you want to double the penalty to the classifier when it mistakenly classifies class 2.

C = ones(5) - eye(5);
C(2,[1 3 4 5]) = 2;
TTMdl = fitcnb(Xtt,Ytt,'Cost',C);

Convert the traditionally trained naive Bayes model to a naive Bayes classification model for incremental learning. Specify the following:

  • A performance metrics warm-up period of 2000 observations.

  • A metrics window size of 500 observations.

  • Use of classification error and minimal cost to measure the performance of the model. You do not have to specify "mincost" for Metrics because incrementalClassificationNaiveBayes always tracks this metric.

IncrementalMdl = incrementalLearner(TTMdl,'MetricsWarmupPeriod',2000,'MetricsWindowSize',500,...
    'Metrics','classiferror');

Fit the incremental model to the second half of the data by using the updateMetricsAndFit function. At each iteration:

  • Simulate a data stream by processing 20 observations at a time.

  • Overwrite the previous incremental model with a new one fitted to the incoming observations.

  • Store the mean of the second predictor within the first class μ12, the cumulative metrics, and the window metrics to see how they evolve during incremental learning.

% Preallocation
nil = numel(Yil);
numObsPerChunk = 20;
nchunk = ceil(nil/numObsPerChunk);
ce = array2table(zeros(nchunk,2),'VariableNames',["Cumulative" "Window"]);
mc = array2table(zeros(nchunk,2),'VariableNames',["Cumulative" "Window"]);
mu12 = [IncrementalMdl.DistributionParameters{1,2}(1); zeros(nchunk,1)];    

% Incremental fitting
for j = 1:nchunk
    ibegin = min(nil,numObsPerChunk*(j-1) + 1);
    iend   = min(nil,numObsPerChunk*j);
    idx = ibegin:iend;    
    IncrementalMdl = updateMetricsAndFit(IncrementalMdl,Xil(idx,:),Yil(idx));
    ce{j,:} = IncrementalMdl.Metrics{"ClassificationError",:};
    mc{j,:} = IncrementalMdl.Metrics{"MinimalCost",:};
    mu12(j + 1) = IncrementalMdl.DistributionParameters{1,2}(1);
end

IncrementalMdl is an incrementalClassificationNaiveBayes model object trained on all the data in the stream. During incremental learning and after the model is warmed up, updateMetricsAndFit checks the performance of the model on the incoming observations, and then fits the model to those observations.

To see how the performance metrics and μ12 evolve during training, plot them on separate tiles.

t = tiledlayout(3,1);
nexttile
plot(mu12)
ylabel('\mu_{12}')
xlim([0 nchunk]);
xline(IncrementalMdl.MetricsWarmupPeriod/numObsPerChunk,'r-.');
nexttile
h = plot(ce.Variables);
xlim([0 nchunk]);
ylabel('Classification Error')
xline(IncrementalMdl.MetricsWarmupPeriod/numObsPerChunk,'r-.');
legend(h,ce.Properties.VariableNames,'Location','northwest')
nexttile
h = plot(mc.Variables);
xlim([0 nchunk]);
ylabel('Minimal Cost')
xline(IncrementalMdl.MetricsWarmupPeriod/numObsPerChunk,'r-.');
legend(h,mc.Properties.VariableNames,'Location','northwest')
xlabel(t,'Iteration')

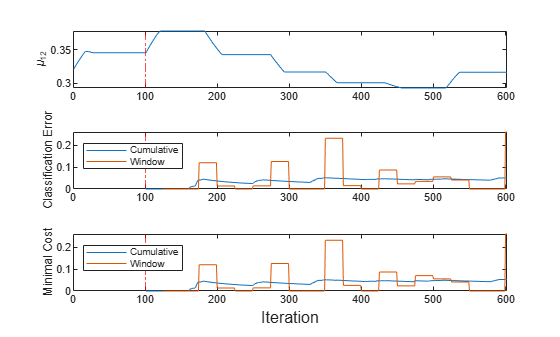
The plots indicate that updateMetricsAndFit performs the following actions:

  • Fit μ12 during all incremental learning iterations.

  • Compute the performance metrics after the metrics warm-up period (red vertical line) only.

  • Compute the cumulative metrics during each iteration.

  • Compute the window metrics after processing 500 observations (25 iterations).

Because the data is ordered by activity, the mean and performance metrics periodically change abruptly.

Input Arguments

collapse all

Traditionally trained naive Bayes model for multiclass classification, specified as a ClassificationNaiveBayes model object returned by fitcnb. The conditional distribution of each predictor variable, as stored in Mdl.DistributionNames, cannot be a kernel distribution.

Name-Value Arguments

Specify optional pairs of arguments as Name1=Value1,...,NameN=ValueN, where Name is the argument name and Value is the corresponding value. Name-value arguments must appear after other arguments, but the order of the pairs does not matter.

Before R2021a, use commas to separate each name and value, and enclose Name in quotes.

Example: 'Metrics',["classiferror" "mincost"],'MetricsWindowSize',100 specifies tracking the misclassification rate and minimal cost, and specifies processing 100 observations before updating the window performance metrics.

Model performance metrics to track during incremental learning with the updateMetrics or updateMetricsAndFit function, specified as a built-in loss function name, string vector of names, function handle (for example, @metricName), structure array of function handles, or cell vector of names, function handles, or structure arrays.

The following table lists the built-in loss function names. You can specify more than one by using a string vector.

NameDescription
"binodeviance"Binomial deviance
"classiferror"Classification error
"exponential"Exponential
"hinge"Hinge
"logit"Logistic
"mincost"Minimal expected misclassification cost (for classification scores that are posterior probabilities)
"quadratic"Quadratic

For more details on the built-in loss functions, see loss.

Example: 'Metrics',["classiferror" "mincost"]

To specify a custom function that returns a performance metric, use function handle notation. The function must have this form.

metric = customMetric(C,S,Cost)

  • The output argument metric is an n-by-1 numeric vector, where each element is the loss of the corresponding observation in the data processed by the incremental learning functions during a learning cycle.

  • You select the function name (here, customMetric).

  • C is an n-by-K logical matrix with rows indicating the class to which the corresponding observation belongs, where K is the number of classes. The column order corresponds to the class order in the ClassNames property. Create C by setting C(p,q) = 1, if observation p is in class q, for each observation in the specified data. Set the other element in row p to 0.

  • S is an n-by-K numeric matrix of predicted classification scores. S is similar to the Score output of predict, where rows correspond to observations in the data and the column order corresponds to the class order in the ClassNames property. S(p,q) is the classification score of observation p being classified in class q.

  • Cost is a K-by-K numeric matrix of misclassification costs. See the 'Cost' name-value argument.

To specify multiple custom metrics and assign a custom name to each, use a structure array. To specify a combination of built-in and custom metrics, use a cell vector.

Example: 'Metrics',struct('Metric1',@customMetric1,'Metric2',@customMetric2)

Example: 'Metrics',{@customMetric1 @customMetric2 'logit' struct('Metric3',@customMetric3)}

updateMetrics and updateMetricsAndFit store specified metrics in a table in the property IncrementalMdl.Metrics. The data type of Metrics determines the row names of the table.

'Metrics' Value Data TypeDescription of Metrics Property Row NameExample
String or character vectorName of corresponding built-in metricRow name for "classiferror" is "ClassificationError"
Structure arrayField nameRow name for struct('Metric1',@customMetric1) is "Metric1"
Function handle to function stored in a program fileName of functionRow name for @customMetric is "customMetric"
Anonymous functionCustomMetric_j, where j is metric j in MetricsRow name for @(C,S,Cost)customMetric(C,S,Cost)... is CustomMetric_1

For more details on performance metrics options, see Performance Metrics.

Data Types: char | string | struct | cell | function_handle

Number of observations the incremental model must be fit to before it tracks performance metrics in its Metrics property, specified as a nonnegative integer. The incremental model is warm after incremental fitting functions fit MetricsWarmupPeriod observations to the incremental model.

For more details on performance metrics options, see Performance Metrics.

Example: 'MetricsWarmupPeriod',50

Data Types: single | double

Number of observations to use to compute window performance metrics, specified as a positive integer.

For more details on performance metrics options, see Performance Metrics.

Example: 'MetricsWindowSize',100

Data Types: single | double

Output Arguments

collapse all

Naive Bayes classification model for incremental learning, returned as an incrementalClassificationNaiveBayes model object. IncrementalMdl is also configured to generate predictions given new data (see predict).

incrementalLearner initializes IncrementalMdl for incremental learning using the model information in Mdl. The following table shows the Mdl properties that incrementalLearner passes to corresponding properties of IncrementalMdl. The function also uses other model properties required to initialize IncrementalMdl, such as Y (class labels) and W (observation weights).

PropertyDescription
CategoricalLevels

Multivariate multinomial predictor levels, a cell array with length equal to NumPredictors

CategoricalPredictorsCategorical predictor indices, a vector of positive integers
ClassNamesClass labels for binary classification, a list of names
CostMisclassification costs, a numeric matrix
DistributionNamesNames of the conditional distributions of the predictor variables, either a cell array in which each cell contains 'normal' or 'mvmn', or the value 'mn'
DistributionParametersParameter values of the conditional distributions of the predictor variables, a cell array of length 2 numeric vectors (for details, see DistributionParameters)
NumPredictorsNumber of predictors, a positive integer
PriorPrior class label distribution, a numeric vector
ScoreTransformScore transformation function, a function name or function handle

More About

collapse all

Incremental Learning

Incremental learning, or online learning, is a branch of machine learning concerned with processing incoming data from a data stream, possibly given little to no knowledge of the distribution of the predictor variables, aspects of the prediction or objective function (including tuning parameter values), or whether the observations are labeled. Incremental learning differs from traditional machine learning, where enough labeled data is available to fit to a model, perform cross-validation to tune hyperparameters, and infer the predictor distribution.

Given incoming observations, an incremental learning model processes data in any of the following ways, but usually in this order:

  • Predict labels.

  • Measure the predictive performance.

  • Check for structural breaks or drift in the model.

  • Fit the model to the incoming observations.

For more details, see Incremental Learning Overview.

Algorithms

collapse all

Performance Metrics

  • The updateMetrics and updateMetricsAndFit functions track model performance metrics (Metrics) from new data only when the incremental model is warm (IsWarm property is true).

    • If you create an incremental model by using incrementalLearner and MetricsWarmupPeriod is 0 (default for incrementalLearner), the model is warm at creation.

    • Otherwise, an incremental model becomes warm after fit or updateMetricsAndFit performs both of these actions:

      • Fit the incremental model to MetricsWarmupPeriod observations, which is the metrics warm-up period.

      • Fit the incremental model to all expected classes (see the MaxNumClasses and ClassNames arguments of incrementalClassificationNaiveBayes).

  • The Metrics property of the incremental model stores two forms of each performance metric as variables (columns) of a table, Cumulative and Window, with individual metrics in rows. When the incremental model is warm, updateMetrics and updateMetricsAndFit update the metrics at the following frequencies:

    • Cumulative — The functions compute cumulative metrics since the start of model performance tracking. The functions update metrics every time you call the functions and base the calculation on the entire supplied data set.

    • Window — The functions compute metrics based on all observations within a window determined by the MetricsWindowSize name-value argument. MetricsWindowSize also determines the frequency at which the software updates Window metrics. For example, if MetricsWindowSize is 20, the functions compute metrics based on the last 20 observations in the supplied data (X((end – 20 + 1):end,:) and Y((end – 20 + 1):end)).

      Incremental functions that track performance metrics within a window use the following process:

      1. Store a buffer of length MetricsWindowSize for each specified metric, and store a buffer of observation weights.

      2. Populate elements of the metrics buffer with the model performance based on batches of incoming observations, and store corresponding observation weights in the weights buffer.

      3. When the buffer is full, overwrite Mdl.Metrics.Window with the weighted average performance in the metrics window. If the buffer overfills when the function processes a batch of observations, the latest incoming MetricsWindowSize observations enter the buffer, and the earliest observations are removed from the buffer. For example, suppose MetricsWindowSize is 20, the metrics buffer has 10 values from a previously processed batch, and 15 values are incoming. To compose the length 20 window, the functions use the measurements from the 15 incoming observations and the latest 5 measurements from the previous batch.

  • The software omits an observation with a NaN score when computing the Cumulative and Window performance metric values.

Version History

Introduced in R2021a