plotSurvival
Plot survival function of Cox proportional hazards model
Syntax
Description
plotSurvival( plots the baseline
survival function of a Cox proportional hazards model coxMdl)coxMdl. The
survival function at time t is the estimated probability of survival
until time t. The term baseline refers to the
survival function at the determined baseline of the predictors. This value is stored in
coxMdl.Baseline, and the default value is the mean of the data set used
for training.
plotSurvival(
plots the survival function for the given value of the stratification variable
coxMdl,X,Stratification)Stratification. You must have one row in
Stratification for each row in X.
Note
When you train coxMdl using stratification variables and
pass predictor variables X,
plotSurvival also requires you to pass
stratification variables.
plotSurvival(___,
specifies additional options using one or more name-value arguments. For example,
Name,Value)plotSurvival(CoxMdl,"Time",T) plots the survival function at times
T.
graphics = plotSurvival(___) returns an array of
Stair graphics objects. See Stair Properties.
Examples
Perform a Cox proportional hazards regression on the lightbulb data set, which contains simulated lifetimes of light bulbs. The first column of the light bulb data contains the lifetime (in hours) of two different types of bulbs. The second column contains a binary variable indicating whether the bulb is fluorescent or incandescent; 0 indicates the bulb is fluorescent, and 1 indicates it is incandescent. The third column contains the censoring information, where 0 indicates the bulb was observed until failure, and 1 indicates the observation was censored.
Fit a Cox proportional hazards model for the lifetime of the light bulbs, accounting for censoring. The predictor variable is the type of bulb.
load lightbulb
coxMdl = fitcox(lightbulb(:,2),lightbulb(:,1), ...
    'Censoring',lightbulb(:,3));
Plot the baseline survival function as a function of time t, meaning the probability that a light bulb fails after time t. By default, the baseline is calculated for the mean of the predictor, which in this case is mean(lightbulb(:,2)) = 0.5.
plotSurvival(coxMdl)

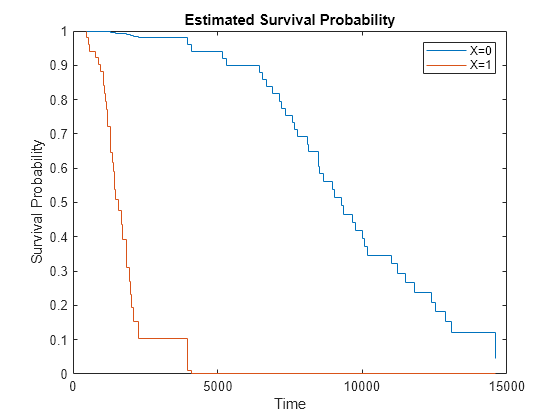
Plot the survival for fluorescent bulbs (predictor = 0) and incandescent bulbs (predictor = 1).
plotSurvival(coxMdl,[0;1])
To calculate the survival without plotting, use survival.
Load the coxModel data. (This simulated data is generated in the example Cox Proportional Hazards Model Object.) The model named coxMdl has three stratification levels (1, 2, and 3) and a predictor X with three categorical values (1, 1/20, and 1/100).
load coxModelPlot the survival for X = 1 at the three stratification levels.
c1 = categorical(1);
X = [c1;c1;c1];
stratification = [1;2;3];
plotSurvival(coxMdl,X,stratification)
xlim([1,30])

Load the coxModel data. (This simulated data is generated in the example Cox Proportional Hazards Model Object.) The model named coxMdl has three stratification levels (1, 2, and 3) and a predictor X with three categorical values (1, 1/20, and 1/100).
load coxModelTo enable programmatic editing of a survival plot, create an axes.
h = figure;
axes1 = axes('Parent',h);
Plot the survival function for the X predictor value categorical(1) and stratification level 3. This stratification level represents a constant hazard rate. When log-scaled, the resulting survival plot should, therefore, be close to a straight line. Plot for times 1 through 30.
oo = categorical(1);
plotSurvival(coxMdl,axes1,oo,3,'Time',linspace(1,30,300));
axes1.YScale = 'log';

Input Arguments
Name-Value Arguments
Version History
Introduced in R2021a