Main Content

resubLoss

Regression error by resubstitution

Description

example

L = resubLoss(tree) returns the resubstitution loss, which is the loss computed for the data that fitrtree used to create tree.

example

L = resubLoss(tree,Name=Value) returns the resubstitution loss with additional options specified by one or more name-value arguments.

[L,se] = resubLoss(___) also returns the standard error of the classification error.

[L,se,NLeaf] = resubLoss(___) also returns the numbers of leaf nodes.

[L,se,NLeaf,bestLevel] = resubLoss(___) also returns the best pruning level. By default, bestLevel is the pruning level that gives loss within one standard deviation of minimal loss.

Examples

collapse all

Load the carsmall data set. Consider Displacement, Horsepower, and Weight as predictors of the response MPG.

load carsmall
X = [Displacement Horsepower Weight];

Grow a regression tree using all observations.

Mdl = fitrtree(X,MPG);

Compute the resubstitution MSE.

resubLoss(Mdl)
ans = 4.8952

Unpruned decision trees tend to overfit. One way to balance model complexity and out-of-sample performance is to prune a tree (or restrict its growth) so that in-sample and out-of-sample performance are satisfactory.

Load the carsmall data set. Consider Displacement, Horsepower, and Weight as predictors of the response MPG.

load carsmall
X = [Displacement Horsepower Weight];
Y = MPG;

Partition the data into training (50%) and validation (50%) sets.

n = size(X,1);
rng(1) % For reproducibility
idxTrn = false(n,1);
idxTrn(randsample(n,round(0.5*n))) = true; % Training set logical indices 
idxVal = idxTrn == false;                  % Validation set logical indices

Grow a regression tree using the training set.

Mdl = fitrtree(X(idxTrn,:),Y(idxTrn));

View the regression tree.

view(Mdl,Mode="graph");

Figure Regression tree viewer contains an axes object and other objects of type uimenu, uicontrol. The axes object contains 27 objects of type line, text. One or more of the lines displays its values using only markers

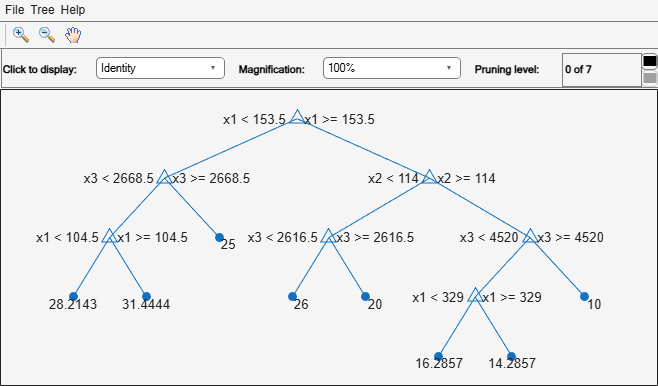
The regression tree has seven pruning levels. Level 0 is the full, unpruned tree (as displayed). Level 7 is just the root node (i.e., no splits).

Examine the training sample MSE for each subtree (or pruning level) excluding the highest level.

m = max(Mdl.PruneList) - 1;
trnLoss = resubLoss(Mdl,SubTrees=0:m)
trnLoss = 7×1

    5.9789
    6.2768
    6.8316
    7.5209
    8.3951
   10.7452
   14.8445

  • The MSE for the full, unpruned tree is about 6 units.

  • The MSE for the tree pruned to level 1 is about 6.3 units.

  • The MSE for the tree pruned to level 6 (i.e., a stump) is about 14.8 units.

Examine the validation sample MSE at each level excluding the highest level.

valLoss = loss(Mdl,X(idxVal,:),Y(idxVal),Subtrees=0:m)
valLoss = 7×1

   32.1205
   31.5035
   32.0541
   30.8183
   26.3535
   30.0137
   38.4695

  • The MSE for the full, unpruned tree (level 0) is about 32.1 units.

  • The MSE for the tree pruned to level 4 is about 26.4 units.

  • The MSE for the tree pruned to level 5 is about 30.0 units.

  • The MSE for the tree pruned to level 6 (i.e., a stump) is about 38.5 units.

To balance model complexity and out-of-sample performance, consider pruning Mdl to level 4.

pruneMdl = prune(Mdl,Level=4);
view(pruneMdl,Mode="graph")
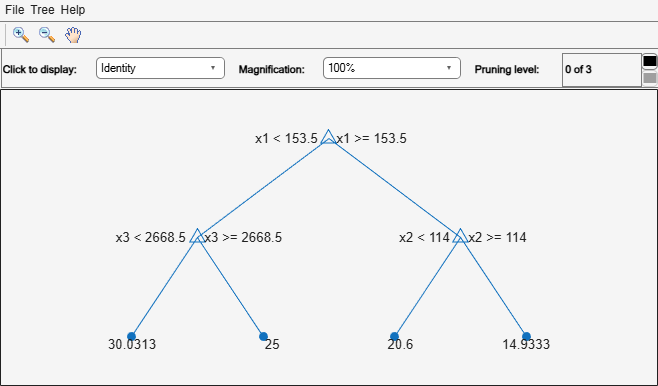
Figure Regression tree viewer contains an axes object and other objects of type uimenu, uicontrol. The axes object contains 15 objects of type line, text. One or more of the lines displays its values using only markers

Input Arguments

collapse all

Regression tree, specified as a RegressionTree object created using the fitrtree function.

Name-Value Arguments

Specify optional pairs of arguments as Name1=Value1,...,NameN=ValueN, where Name is the argument name and Value is the corresponding value. Name-value arguments must appear after other arguments, but the order of the pairs does not matter.

Example: L = resubloss(tree,Subtrees="all") prunes all subtrees.

Before R2021a, use commas to separate each name and value, and enclose Name in quotes.

Example: L = resubloss(tree,"Subtrees","all") prunes all subtrees.

Loss function, specified as a function handle or "mse" for mean squared error.

You can write your own loss function in the syntax described in Loss Functions.

Data Types: char | string | function_handle

Pruning level, specified as a vector of nonnegative integers in ascending order or "all".

If you specify a vector, then all elements must be at least 0 and at most max(tree.PruneList). 0 indicates the full, unpruned tree and max(tree.PruneList) indicates the completely pruned tree (in other words, just the root node).

If you specify "all", then resubLoss operates on all subtrees (in other words, the entire pruning sequence). This specification is equivalent to using 0:max(tree.PruneList).

resubLoss prunes tree to each level indicated in Subtrees, and then estimates the corresponding output arguments. The size of Subtrees determines the size of some output arguments.

To invoke Subtrees, the properties PruneList and PruneAlpha of tree must be nonempty. In other words, grow tree by setting Prune="on", or by pruning tree using prune.

Example: Subtrees="all"

Data Types: single | double | char | string

Tree size, specified as one of the following:

  • "se" — The resubloss function returns the highest pruning level with loss within one standard deviation of the minimum (L + se, where L and se relate to the smallest value in Subtrees).

  • "min" — The resubloss function returns the element of Subtrees with smallest loss, which is usually the smallest element of Subtrees.

Example: TreeSize="min"

Output Arguments

collapse all

Regression loss, returned as a vector of the length of Subtrees.

Standard error of loss, returned as a vector of the length of Subtrees.

Number of leaves (terminal nodes) in the pruned subtrees, returned as a vector of the length of Subtrees.

Optimal pruning level, returned as a nonnegative numeric scalar whose value depends on TreeSize:

  • When TreeSize is "se", then bestLevel is the highest pruning level with loss within one standard deviation of the minimum (L + se, where L and se relate to the smallest value in Subtrees).

  • When TreeSize is "min", then bestLevel is the element of Subtrees with the smallest loss, usually the smallest element of Subtrees.

More About

collapse all

Loss Functions

The built-in loss function is "mse", meaning mean squared error.

To write your own loss function, create a function file of the form

function loss = lossfun(Y,Yfit,W)
  • N is the number of rows of tree.X.

  • Y is an N-element vector representing the observed response.

  • Yfit is an N-element vector representing the predicted responses.

  • W is an N-element vector representing the observation weights.

  • The output loss should be a scalar.

Pass the function handle @lossfun as the value of the LossFun name-value argument.

Extended Capabilities

Version History

Introduced in R2011a