flightLogSignalMapping
Visualize UAV flight logs
Description
The flightLogSignalMapping object maps flight log messages to
signals that you can use to visualize the messages.
To inspect UAV logs, first load your log file using mavlinktlog, ardupilotreader or
ulogreader. Use the
preconfigured signal mapping, or map your own signal using mapSignal or
mapulog. Then, use
show to display the
list of configured plots.
For ease of use, see the provided Predefined Signals and Predefined Plots. You can also
view the details of the signals and plots of a flightLogSignalMapping
object by using the info object
function.
Creation
Description
mapper = flightLogSignalMappingmapSignal.
mapper = flightLogSignalMapping("tlog")
mapper = flightLogSignalMapping("ulog")mapulog
function to map log messages from different PX4 versions.
mapper = flightLogSignalMapping("bin")
Properties
Object Functions
checkSignal | Check mapped signal |
copy | Create deep copy of flight log signal mapping object |
extract | Extract UAV flight log signals as timetables |
info | Signal mapping and plot information for UAV log signal mapping |
mapSignal | Map UAV flight log signal |
mapulog | Map PX4 ULOG messages to signals |
show | Display plots for inspection of UAV logs |
updatePlot | Update UAV flight log plot functions |
Examples
Download the magFailLog.ulg flight log file from MathWorks website. This sample flight log is available from the PX4® Flight Review website [1].
magFailLog = matlab.internal.examples.downloadSupportFile("uav","data/magFailLog.ulg");
Read the flight log.
data = ulogreader(magFailLog);
Create a flight log signal mapping object.
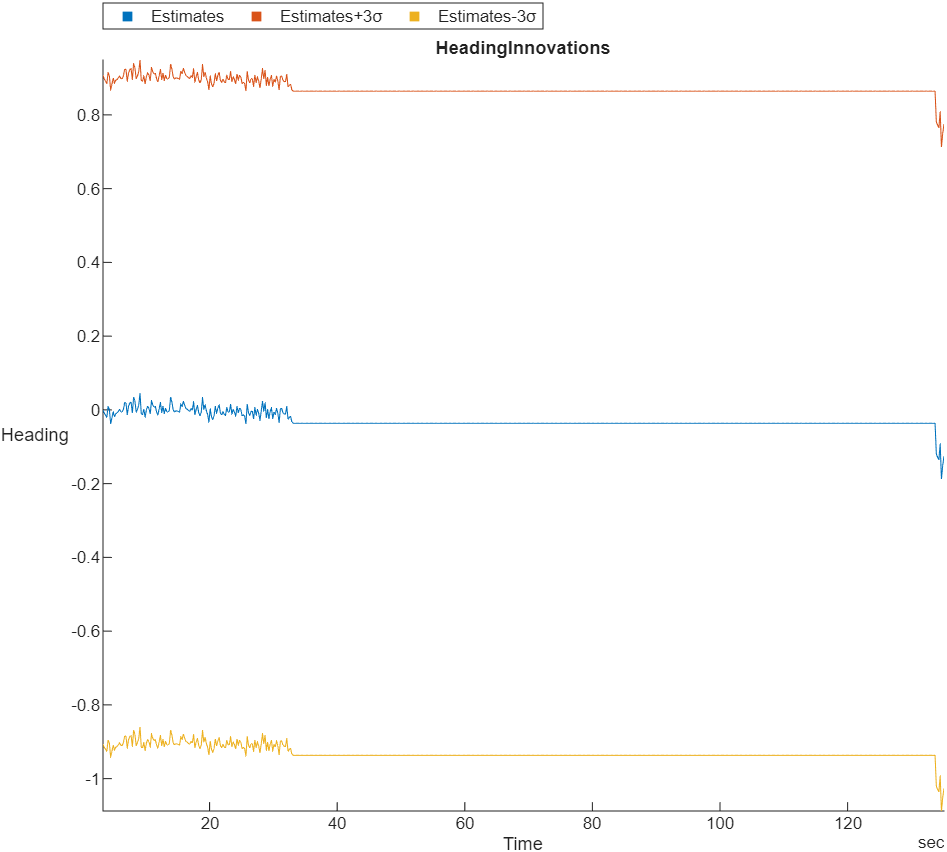
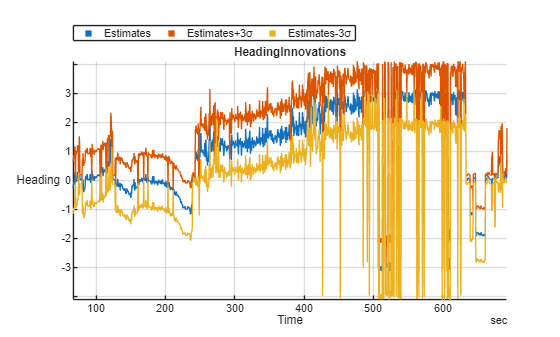
mapper = flightLogSignalMapping('ulog');Plot the EKF heading innovations and its variance using the predefined plot. The plot shows that after 200 seconds, the heading innovation starts to increase, which indicates a less precise heading estimate.
show(mapper,data,PlotsToShow="HeadingInnovations")
grid on
Extract the EKF heading innovations signal as a timetable.
innovationsHeading = extract(mapper, data, "EstimatorInnovationHeading");Extract the EKF magnetometer status signal as a timetable.
magStatusFlags = extract(mapper, data, "EstimatorStatusFlagMagnetometer");Combine the EKF heading innovations and magnetometer status timetables.
combinedData1 = synchronize(magStatusFlags{1}, ...
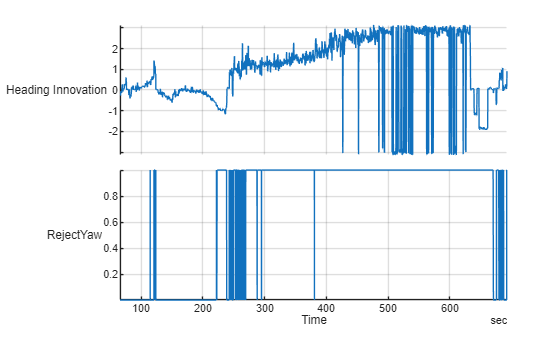
innovationsHeading{1}, "union", "nearest");Plot the heading innovation and the RejectYaw fields.
The plot indicates that the EKF rejects the heading estimate when the heading innovation is outside the range of -1 to 1, which mostly happens after 200 seconds.
stackedplot(combinedData1(:,["Heading", "RejectYaw"]), ...
DisplayLabels=["Heading Innovation","RejectYaw"])
grid on
To analyze the possible cause of the heading estimate failure, extract the EKF magnetometer innovations signal as a timetable.
innovationsMagnetometer = extract(mapper,data,"EstimatorInnovationMagnetometer");Extract the magnetometer reading from the IMU Sensor.
magnetometerReading = extract(mapper,data,"Mag");Combine the EKF magnetometer innovations and magnetometer status timetables.
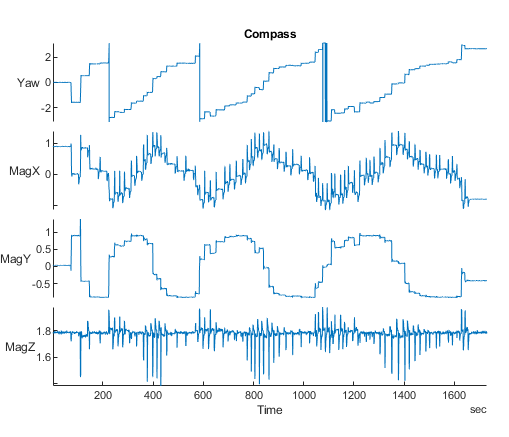
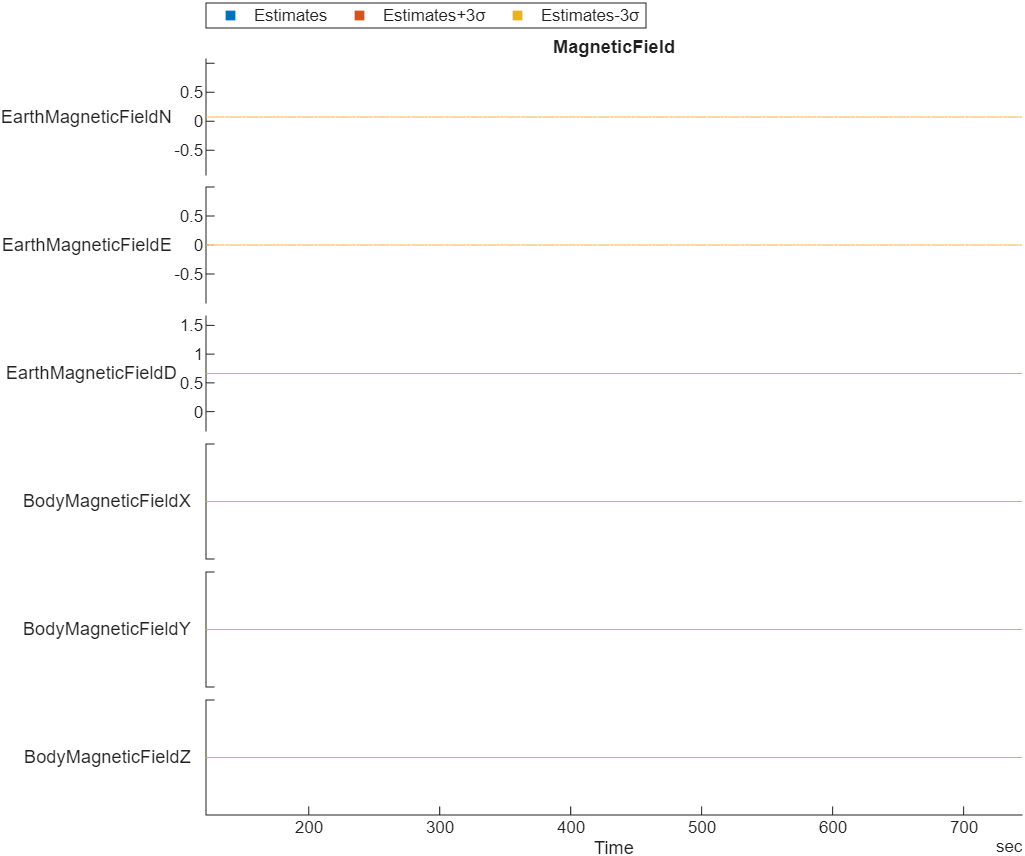
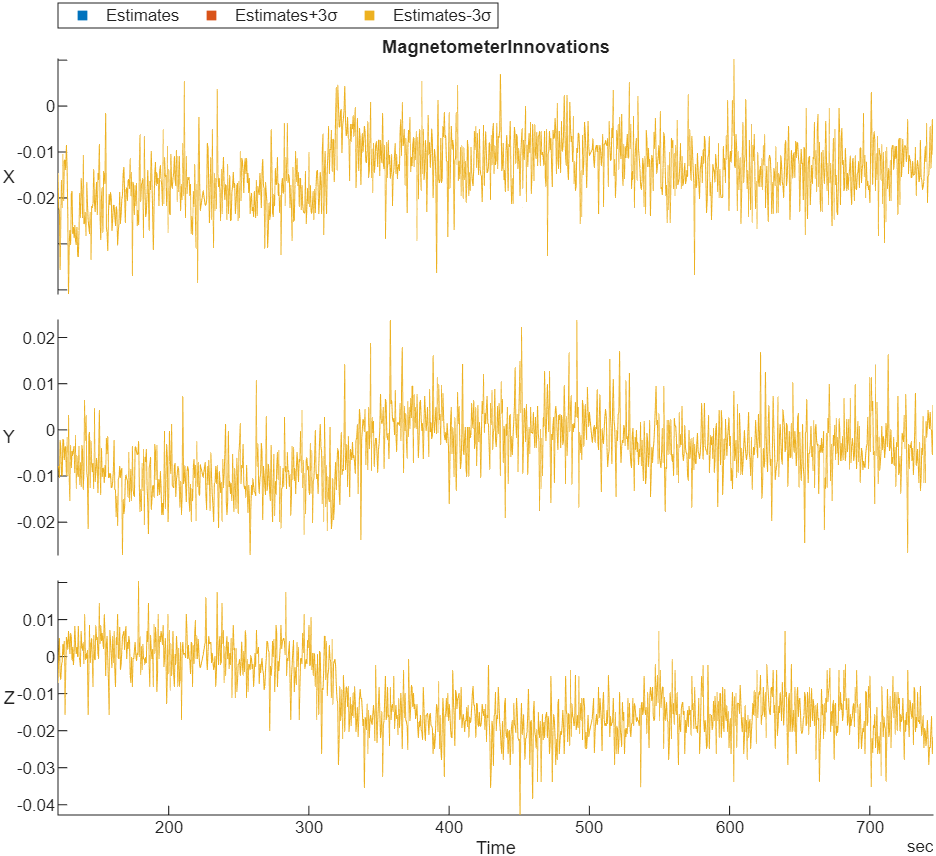
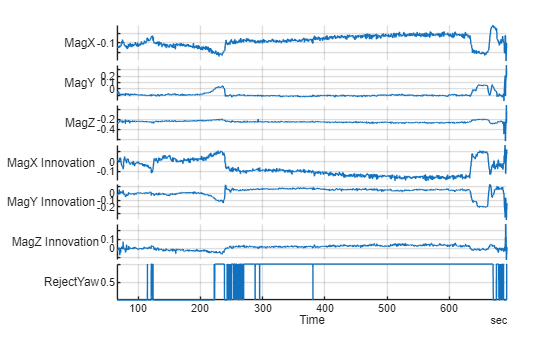
combinedData2 = synchronize(magStatusFlags{1},innovationsMagnetometer{1},magnetometerReading{1},"union", "nearest");Plot the magnetometer reading, magnetometer innovations, and RejectYaw fields.
The plots indicate that the EKF rejects the yaw estimate when at least one axis of the magnetometer has a innovation that is outside the range of -0.1 to 0.1. This indicates that the heading estimation failure is likely caused by compass that is faulty or not properly calibrated.
stackedplot(combinedData2(:,["MagX","MagY","MagZ","X","Y","Z","RejectYaw"]), ...
DisplayLabels=["MagX","MagY","MagZ","MagX Innovation","MagY Innovation", ...
"MagZ Innovation","RejectYaw"])
grid on
References
https://review.px4.io/plot_app?log=62eb2fe6-8a78-4d78-9fab-1bd02c045c10, accessed March 13, 2025.
More About
After mapping signals to the list of predefined signals, you can use specific predefined plots
with the show object
function. To view a list of available plots and their associated signals for a
flightLogSignalMapping object, use the info object
function. If you want to define custom plots based on signals, use the updatePlot
object function.
Each predefined plot has a set of required signals that it must map.
Predefined Plots
| Plot | Description | Signals |
|---|---|---|
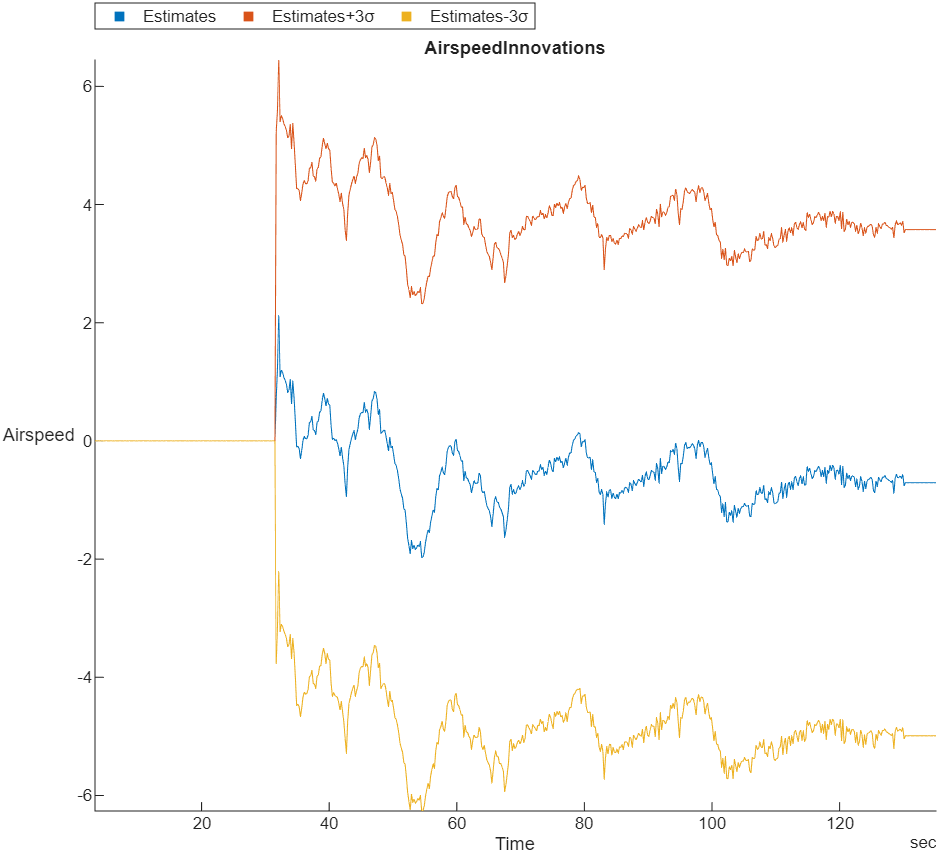
| Extended Kalman Filter (EKF) airspeed innovation and innovation variance | EstimatorInnovationAirspeed |
| Stacked plot of roll, pitch, and yaw angles and body rotation rates | AttitudeEuler, AttitudeRate, Gyro# |
| Estimated attitude of the UAV and the attitude target set point | AttitudeEuler, AttitudeTargetEuler |
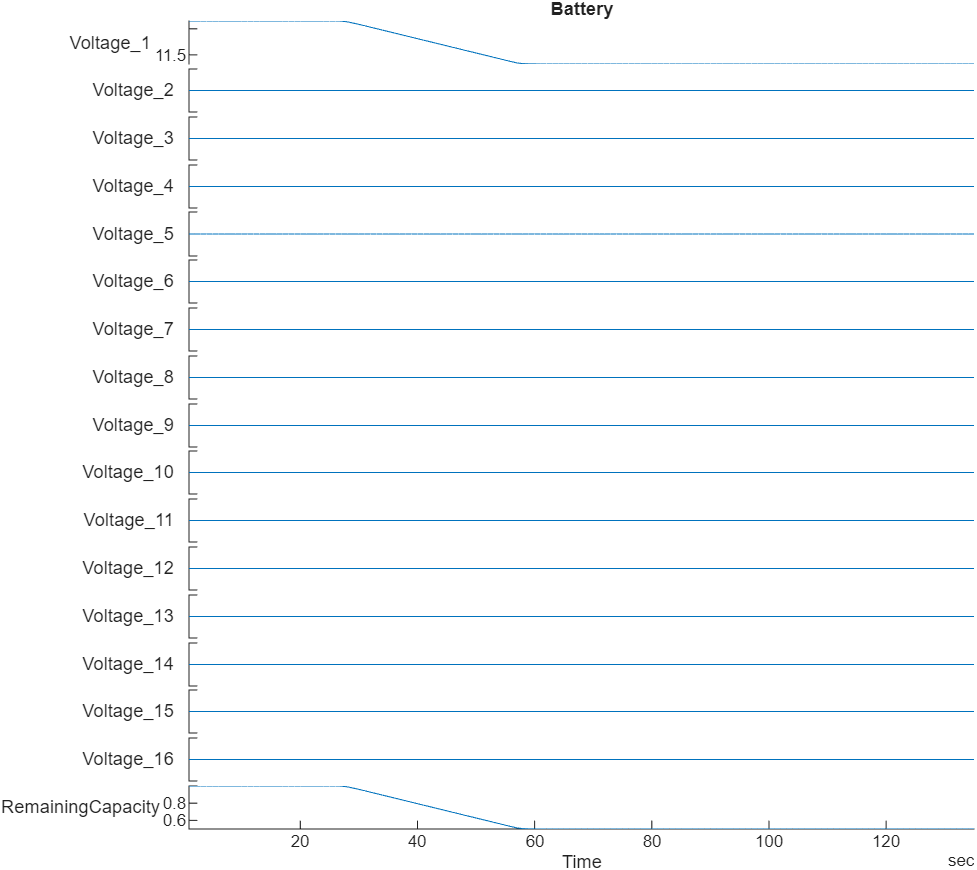
| Stacked plot of battery voltage | Battery |
| Estimated yaw and magnetometer readings | AttitudeEuler, Mag#, GPS# |
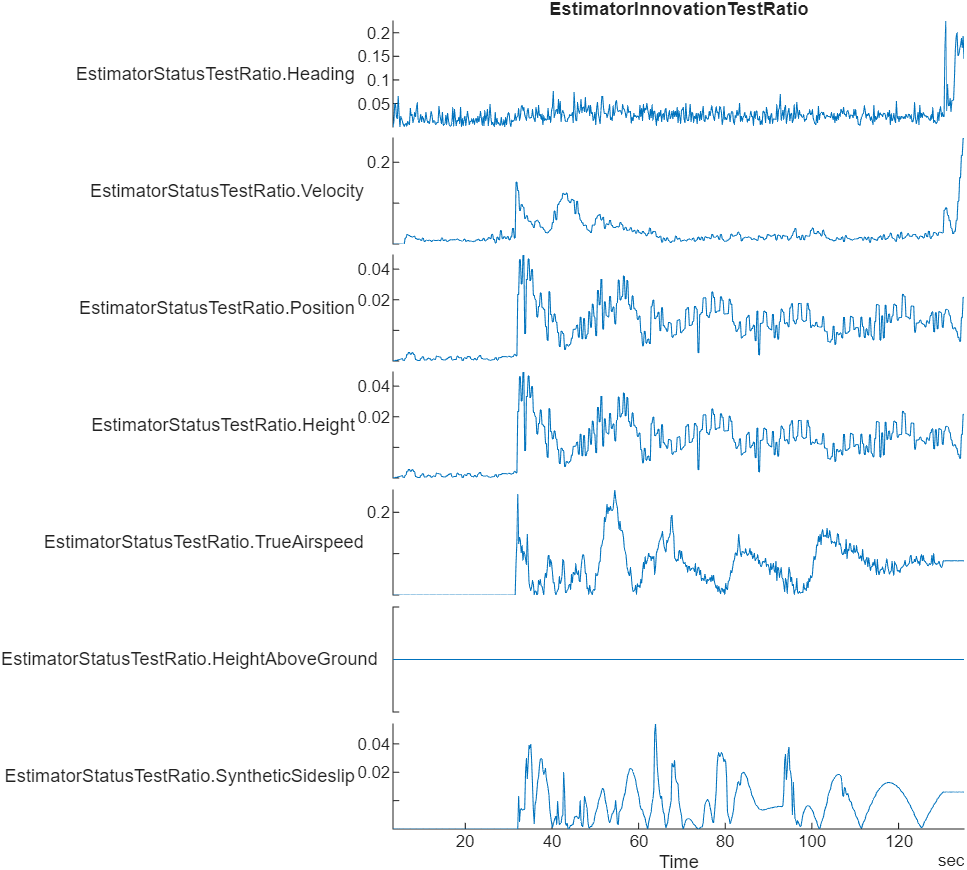
| Stacked plot of the ratio of the largest EKF innovation to the innovation test limit | EstimatorStatusTestRatio |
| Raw Lat-Lon plot for GPS sensor readings | GPS# |
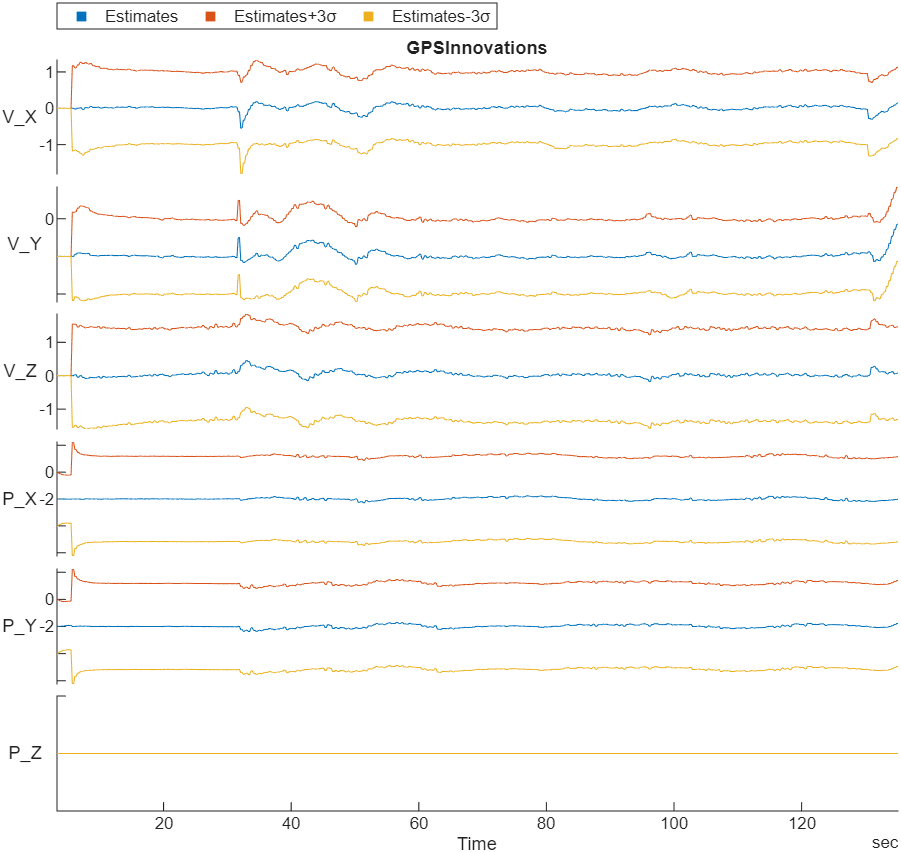
| Stacked plot of EKF GPS velocity and position innovations, and innovation variances | EstimatorInnovationGPS |
| Stacked plot of EKF heading innovation and innovation variance | EstimatorInnovationHeading |
| Stacked plots of barometer reading, GPS altitude reading, and fused height estimate | Barometer#, GPS#, LocalNED |
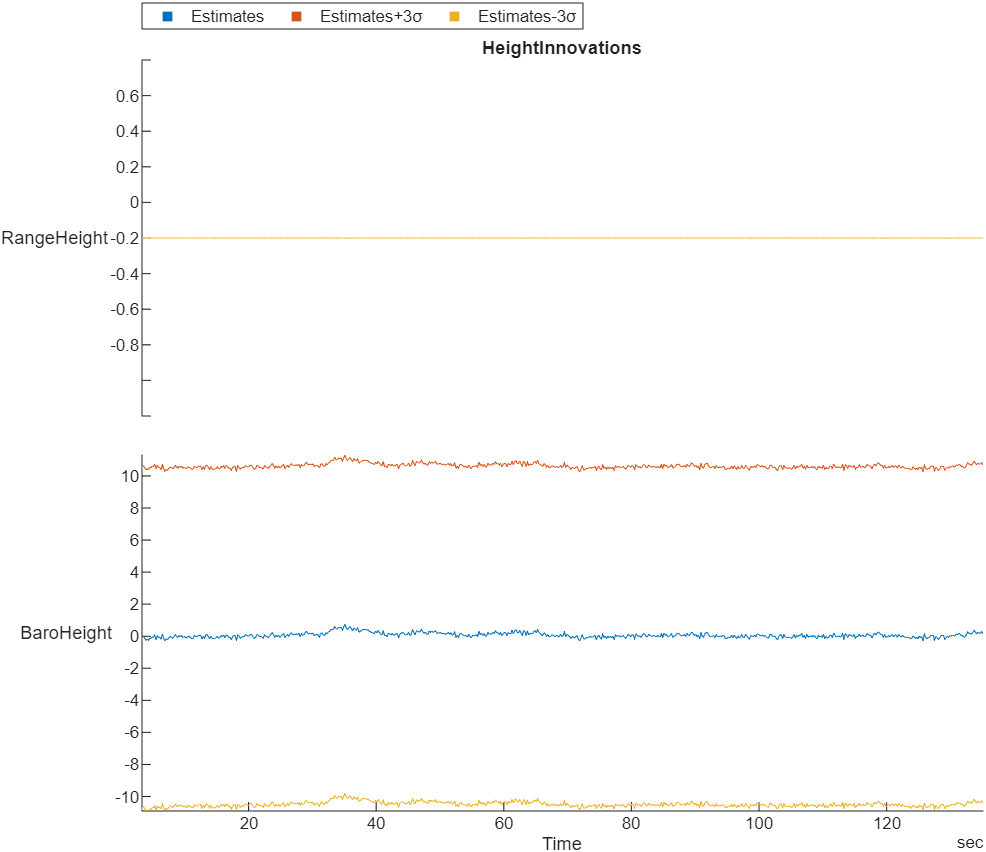
| Stacked plot of EKF range sensor and barometer height innovations and innovation variances | EstimatorInnovationHeight |
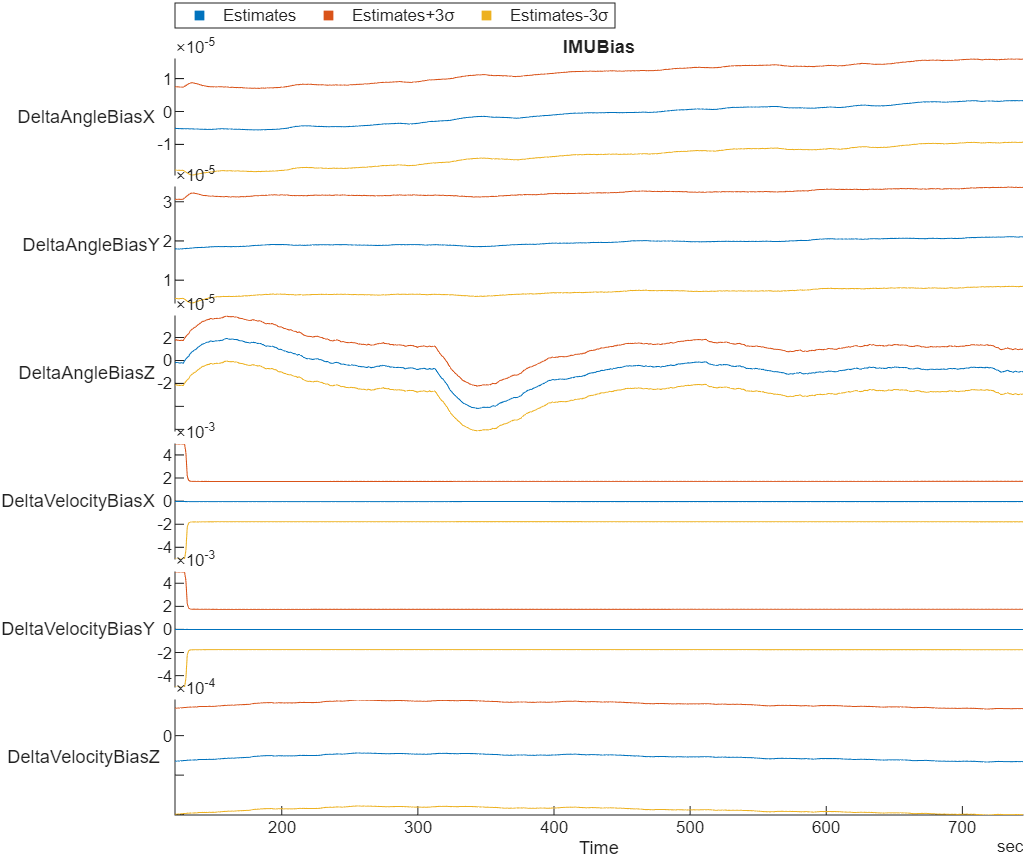
| Stacked plot of EKF inertial measurement unit (IMU) delta angle and velocity bias estimates and bias estimate variances | EstimatorStatesIMUBias |
| Stacked plot of EKF Earth magnetic field and UAV body frame magnetic field bias estimates and bias estimate variances | EstimatorStatesMagnetometerBias |
| Stacked plot of EKF Earth magnetic field and UAV body frame magnetic field bias estimates and bias estimates variances | EstimatorInnovationMagnetometert |
| Stacked plot of ground velocity and air speed | GPS#, Airspeed# |
| Trajectory in local NED coordinates versus target set points | LocalNED, LocalNEDTarget |
| Error between desired and actual position in NED coordinates | LocalNED, LocalNEDTarget |
| Error between desired and actual velocity in NED coordinates | LocalNEDVel, LocalNEDVelTarget |
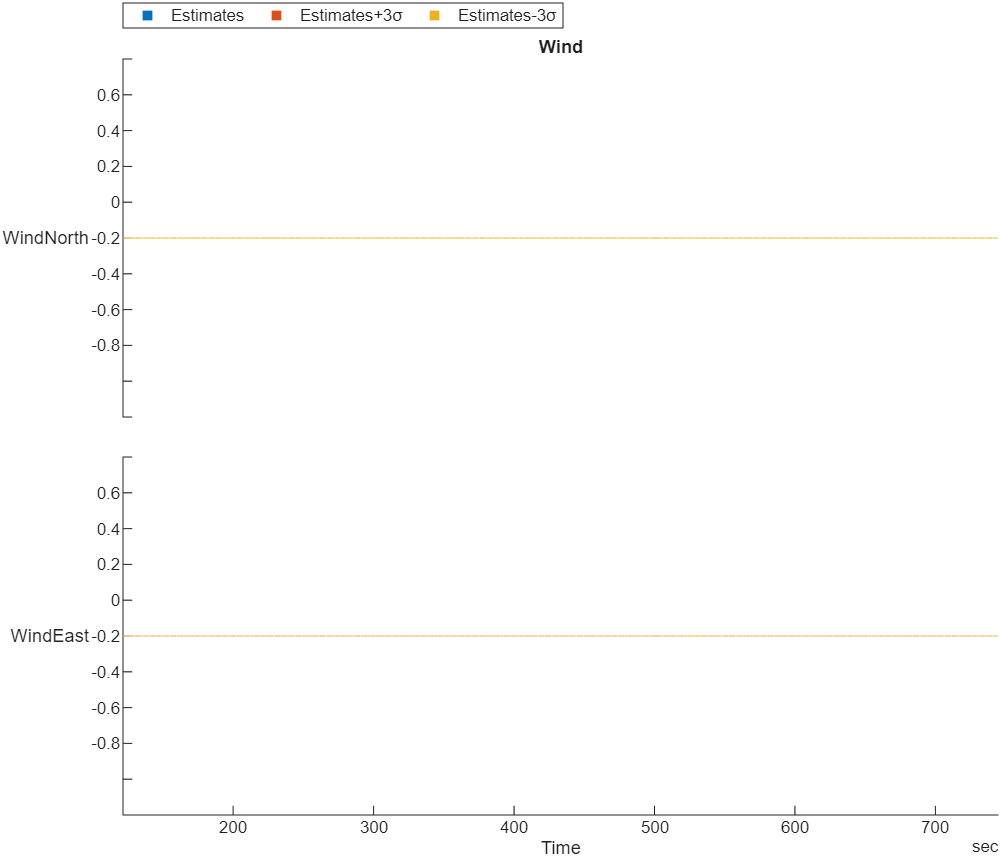
| Wind estimate and estimate variance | EstimatorStatesWind |