Accel# | Raw accelerometer reading from IMU sensor | AccelX, AccelY, AccelZ | m/s^2, m/s^2, m/s^2 |
Airspeed# | Airspeed reading of pressure differential, indicated air speed, and temperature | PressDiff, IndicatedAirSpeed, Temperature | Pa, m/s, degreeC |
AttitudeEuler | Attitude of UAV in Euler (ZYX) form | Roll, Pitch, Yaw | rad, rad, rad |
AttitudeRate | Angular velocity along each body axis | BodyRotationRateX, BodyRotationRateY, BodyRotationRateZ | rad/s, rad/s, rad/s |
AttitudeTargetEuler | Target attitude of UAV in Euler (ZYX) form | TargetRoll, TargetPitch, TargetYaw | rad, rad, rad |
Barometer# | Barometer readings for absolute pressure, relative pressure, and temperature | PressAbs, PressAltitude, Temperature | Pa, m, degreeC |
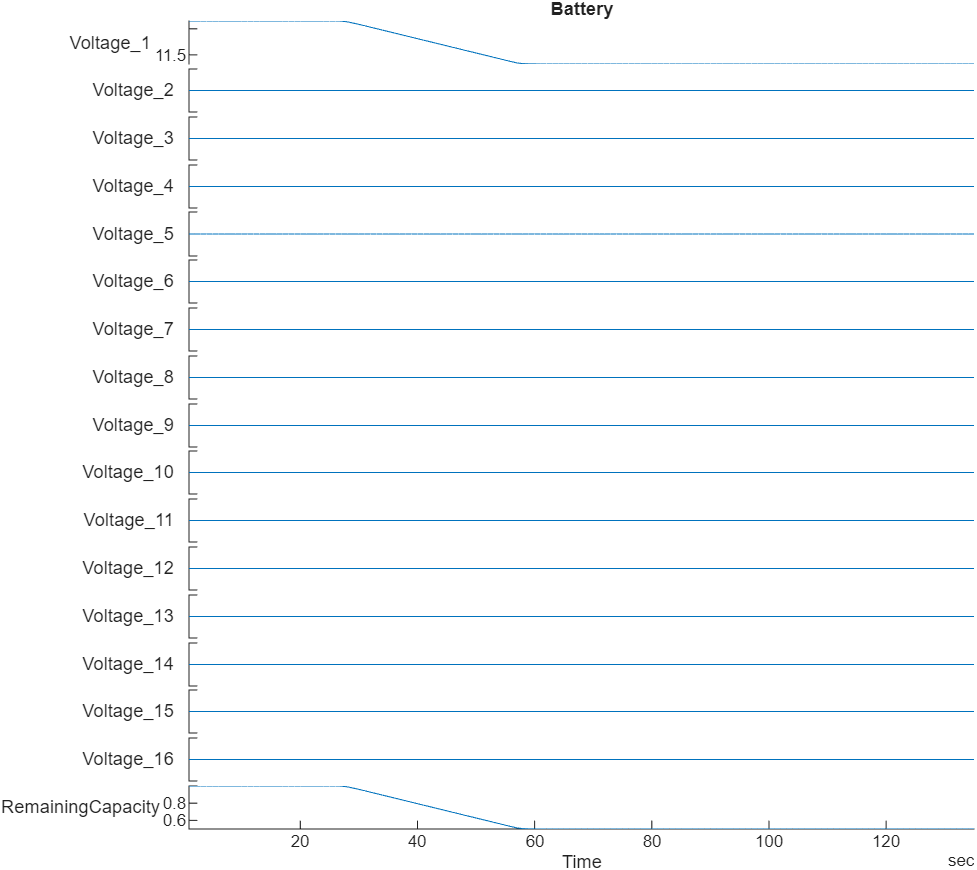
Battery | Voltage readings for battery and remaining battery capacity (%) | Voltage1,Voltage2, ... Voltage16, RemainingCapacity | v, v, ... v, % |
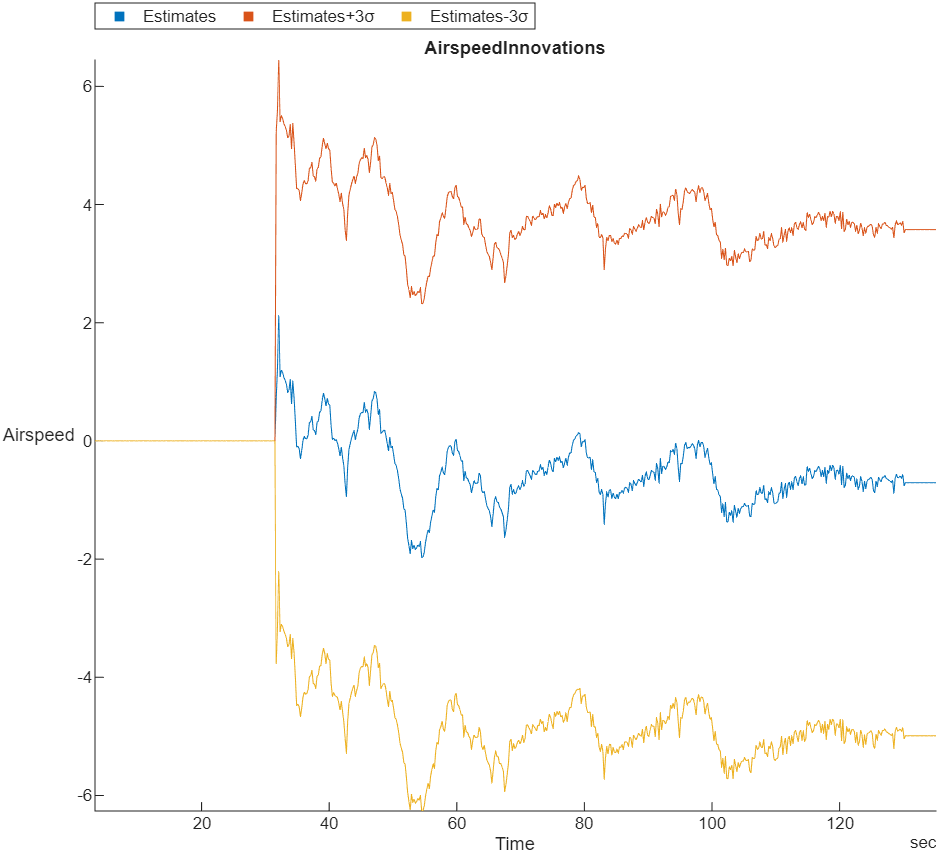
EstimatorInnovationAirspeed | Extended Kalman Filter (EKF) airspeed innovation and innovation
variance | Airspeed, Var_Airspeed | m/s, (m/s)^2 |
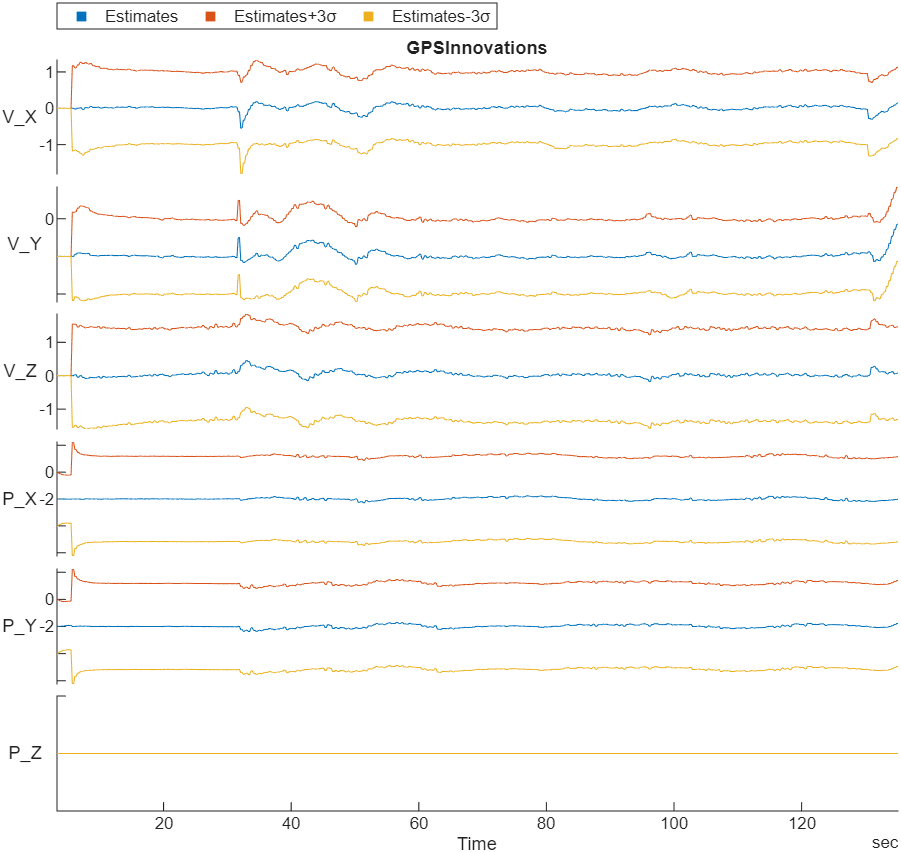
EstimatorInnovationGPS | EKF GPS velocity and position innovations and innovation
variances | V_X, V_Y, V_Z, P_X, P_Y, P_Z, Var_V_X, Var_V_Y, Var_V_Z,
Var_P_X, Var_P_Y, Var_P_Z | m/s, m/s, m/s, m, m, m, (m/s)^2, (m/s)^2, (m/s)^2, m^2, m^2,
m^2 |
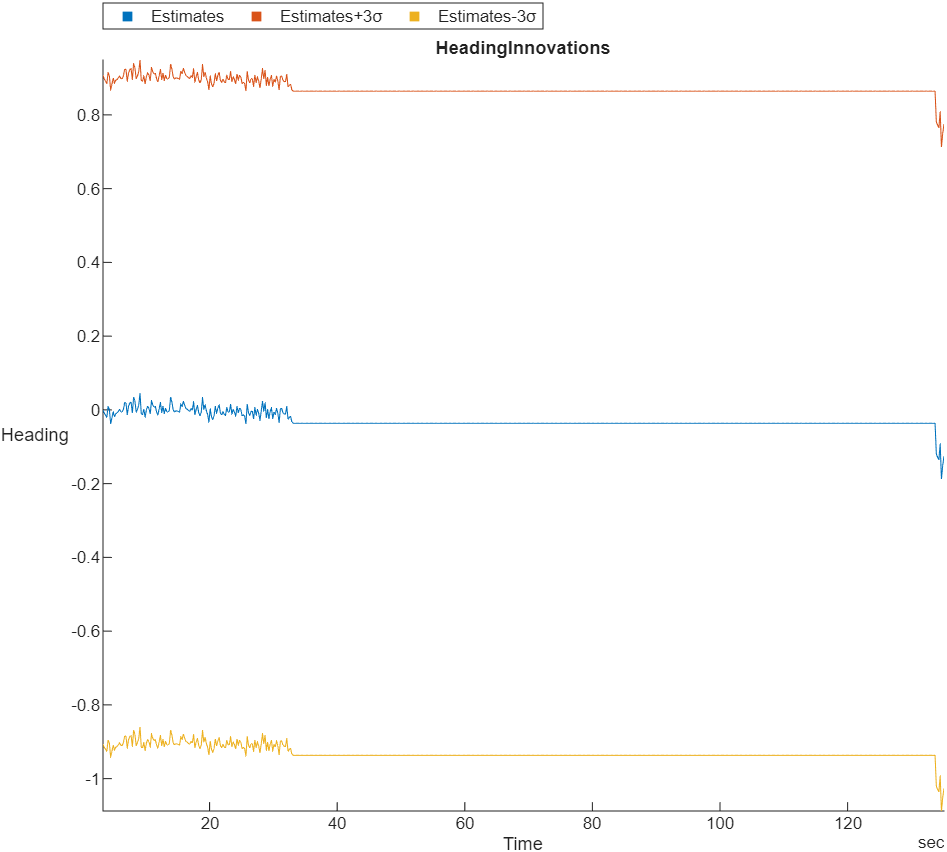
EstimatorInnovationHeading | EKF heading innovation and innovation variance | Heading, Var_Heading | rad, rad^2 |
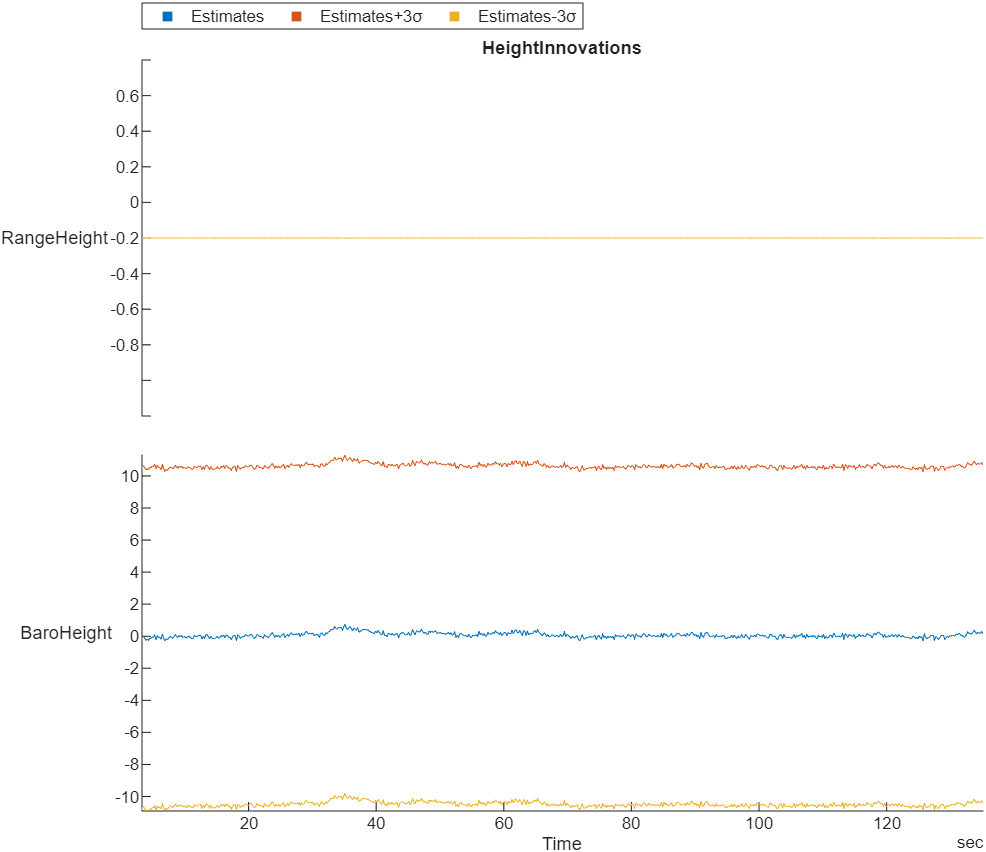
EstimatorInnovationHeight | EKF range sensor and barometer height innovations and innovation
variances | RangeHeight, BaroHeight, Var_RangeHeight,
Var_BaroHeight | m, m^2, m^2 |
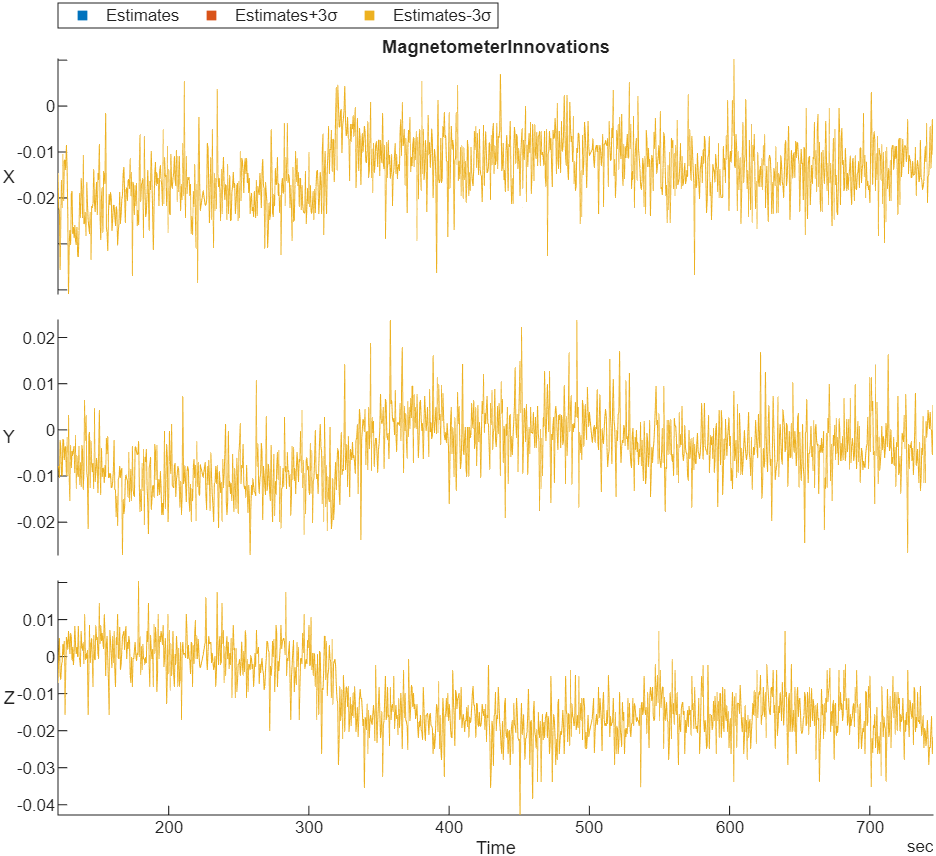
EstimatorInnovationMagnetometer | EKF magnetometer innovation and innovation variance | X, Y, Z, Var_X, Var_Y, Var_Z | Gauss, Gauss, Gauss, Gauss^2, Gauss^2, Gauss^2
|
EstimatorInnovationOpticalFlow | EKF optical flow sensor innovation and innovation variance | X, Y, Var_X, Var_Y | rad/sec, rad/sec, (rad/sec)^2, (rad/sec)^2 |
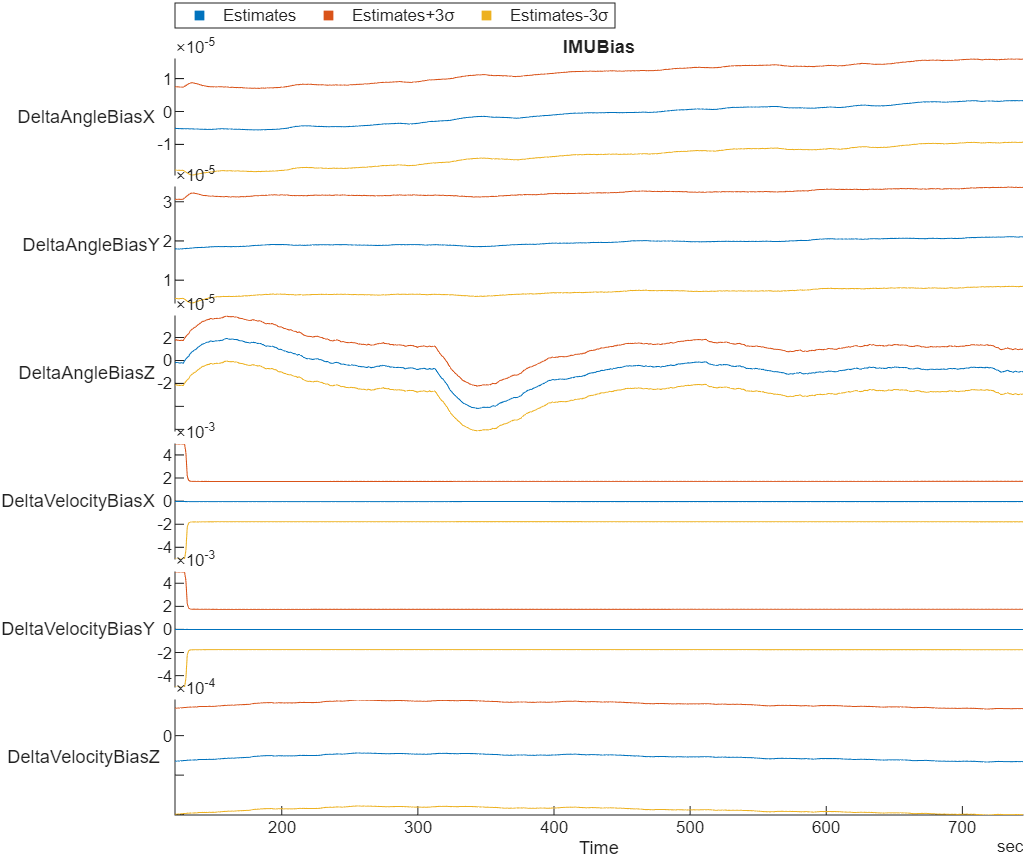
EstimatorStatesIMUBias | EKF inertial measurement unit (IMU) delta angle and velocity bias
estimates and bias estimate variances | DeltaAngleBiasX, DeltaAngleBiasY, DeltaAngleBiasZ",
DeltaVelocityBiasX, DeltaVelocityBiasY, DeltaVelocityBiasZ,
Var_DeltaAngleBiasX, Var_DeltaAngleBiasY, Var_DeltaAngleBiasZ,
Var_DeltaVelocityBiasX, Var_DeltaVelocityBiasY,
Var_DeltaVelocityBiasZ | rad, rad, rad, m/s, m/s, m/s, rad^2, rad^2, rad^2, (m/s)^2,
(m/s)^2, (m/s)^2 |
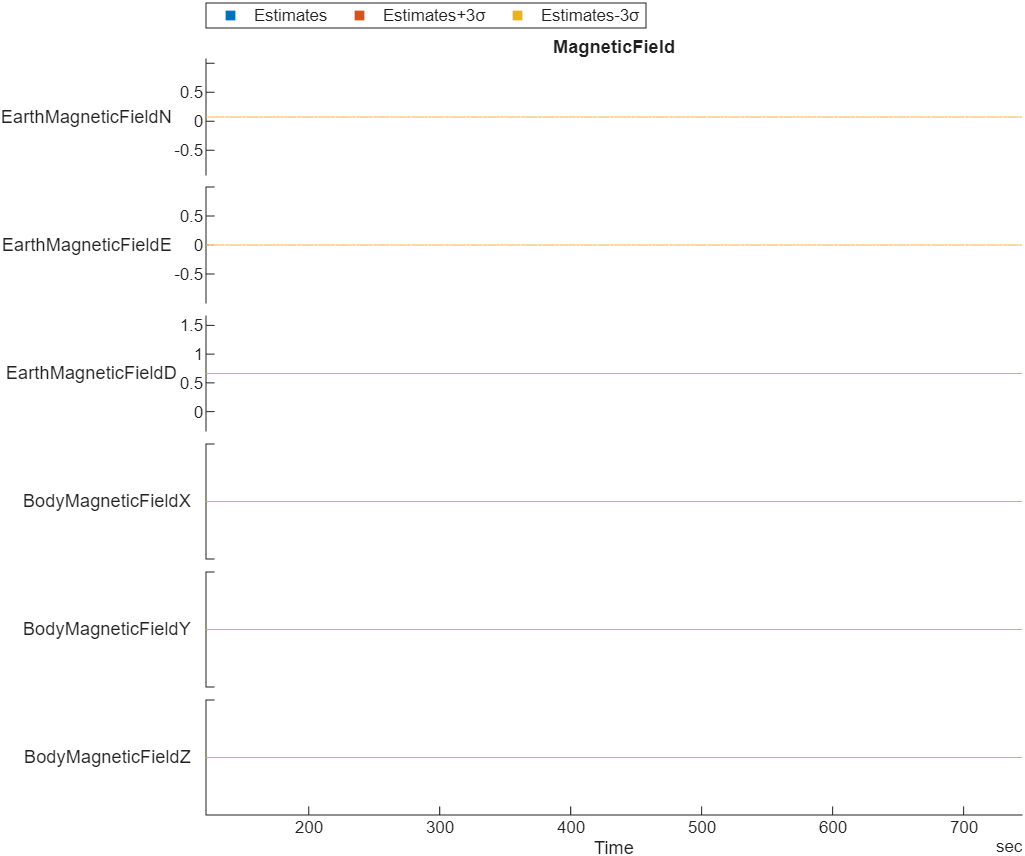
EstimatorStatesMagnetometerBias | EKF Earth magnetic field and UAV body frame magnetic field bias estimates
and bias estimate variances | EarthMagneticFieldN, EarthMagneticFieldE, EarthMagneticFieldD,
BodyMagneticFieldX, BodyMagneticFieldY, BodyMagneticFieldZ,
Var_EarthMagneticFieldN, Var_EarthMagneticFieldE,
Var_EarthMagneticFieldD, Var_BodyMagneticFieldX, Var_BodyMagneticFieldY,
Var_BodyMagneticFieldZ | gauss, gauss, gauss, gauss, gauss, gauss, gauss^2, gauss^2,
gauss^2, gauss^2, gauss^2, gauss^2 |
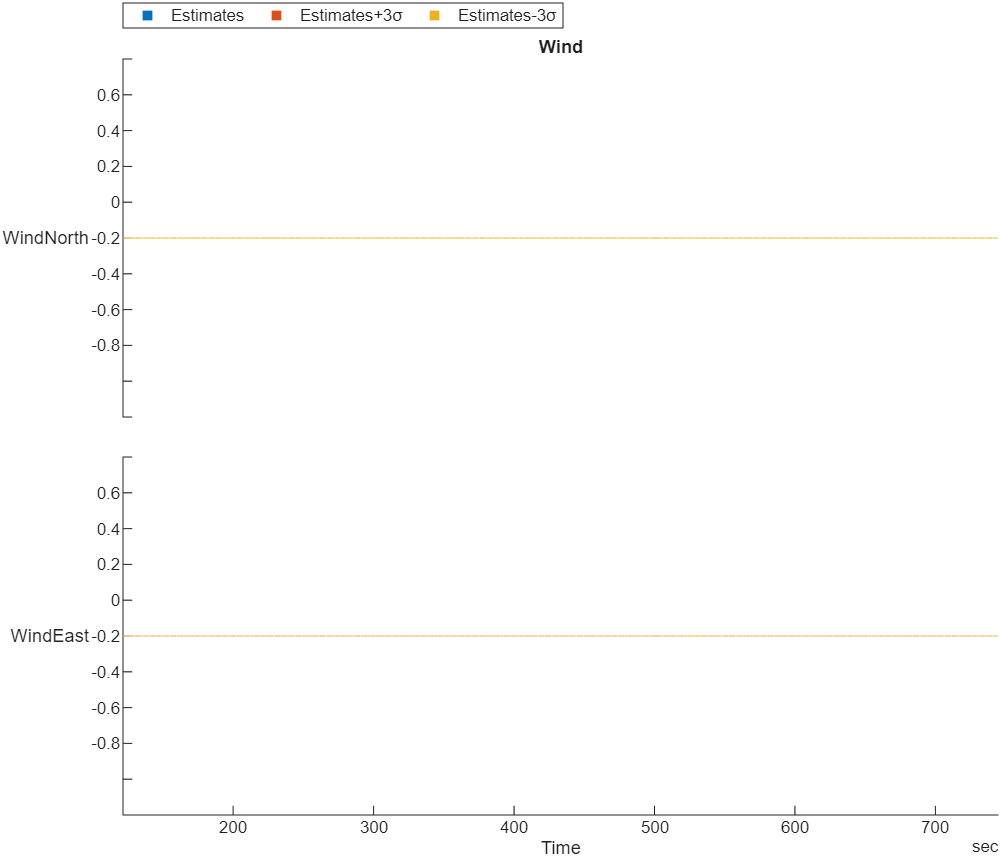
EstimatorStatesWind | EKF wind estimate and estimate variance | WindNorth, WindEast, Var_WindNorth,
Var_WindEast | m/s, m/s, (m/s)^2, (m/s)^2 |
EstimatorStatusControlMode | EKF logic states, specified as logical values | CS_TILT_ALIGN, CS_YAW_ALIGN, CS_GPS, CS_OPT_FLOW, CS_MAG_HDG,
CS_MAG_3D, CS_MAG_DEC, CS_IN_AIR, CS_WIND, CS_BARO_HGT, CS_RNG_HGT,
CS_GPS_HGT, CS_EV_POS, CS_EV_YAW, CS_EV_HGT, CS_BETA, CS_MAG_FIELD,
CS_FIXED_WING, CS_MAG_FAULT, CS_ASPD, CS_GND_EFFECT, CS_RNG_STUCK,
CS_GPS_YAW, CS_MAG_ALIGNED, CS_EV_VEL, CS_SYNTHETIC_MAG_Z,
CS_VEHICLE_AT_REST, CS_GPS_YAW_FAULT, CS_RNG_FAULT | None |
EstimatorStatusFlagAirspeed | Flag that indicates whether the EKF rejects the airspeed
observation | RejectAirspeed | None |
EstimatorStatusFlagHeightAboveGround | Flag that indicates whether the EKF rejects the height above ground
observation | RejectHeightAboveGround | None |
EstimatorStatusFlagHorizontalStates | Flags that indicate whether the EKF rejects the horizontal velocity and
position observations | RejectVelocity, RejectPosition | None |
EstimatorStatusFlagMagnetometer | Flags that indicate whether the EKF rejects the magnetometer and yaw
observations | RejectX, RejectY, RejectZ, RejectYaw | None |
EstimatorStatusFlagOpticalFlow | Flags that indicate whether the EKF rejects the optical flow
observations | RejectX, RejectY | None |
EstimatorStatusFlagSideslip | Flag that indicates whether the EKF rejects the synthetic sideslip
observation | RejectSyntheticSideslip | None |
EstimatorStatusFlagVerticalStates | Flags that indicate whether the EKF rejects the vertical velocity and
position observations | RejectVelocity, RejectPosition | None |
EstimatorStatusFilterFault | Flags that indicate whether the EKF encounters faults such as numerical
errors, bad data, or clipping | NUMERIC_ERROR_MAG_X, NUMERIC_ERROR_MAG_Y, NUMERIC_ERROR_MAG_Z,
NUMERIC_ERROR_MAG_HDG, NUMERIC_ERROR_MAG_DEC, NUMERIC_ERROR_ASPD,
NUMERIC_ERROR_SYNTHETIC_BETA, NUMERIC_ERROR_OPT_FLOW_X,
NUMERIC_ERROR_OPT_FLOW_Y, NUMERIC_ERROR_VEL_N, NUMERIC_ERROR_VEL_E,
NUMERIC_ERROR_VEL_D, NUMERIC_ERROR_POS_N, NUMERIC_ERROR_POS_E,
NUMERIC_ERROR_POS_D, NUMERIC_BAD_DELTA_VEL_BIAS,
NUMERIC_BAD_VERTICAL_ACCEL, NUMERIC_DELTA_VEL_CLIPPING | None |
EstimatorStatusGPSCheckFail | Flags that indicate the status of GPS checks | GPS_CHECK_FAIL_GPS_FIX, GPS_CHECK_FAIL_MIN_SAT_COUNT,
GPS_CHECK_FAIL_MAX_PDOP GPS_CHECK_FAIL_MAX_HORZ_ERR,
GPS_CHECK_FAIL_MAX_VERT_ERR, GPS_CHECK_FAIL_MAX_SPD_ERR,
GPS_CHECK_FAIL_MAX_HORZ_DRIFT, GPS_CHECK_FAIL_MAX_VERT_DRIFT,
GPS_CHECK_FAIL_MAX_HORZ_SPD_ERR, GPS_CHECK_FAIL_MAX_VERT_SPD_ERR,
GPS_CHECK_FAIL_SPOOFED | None |
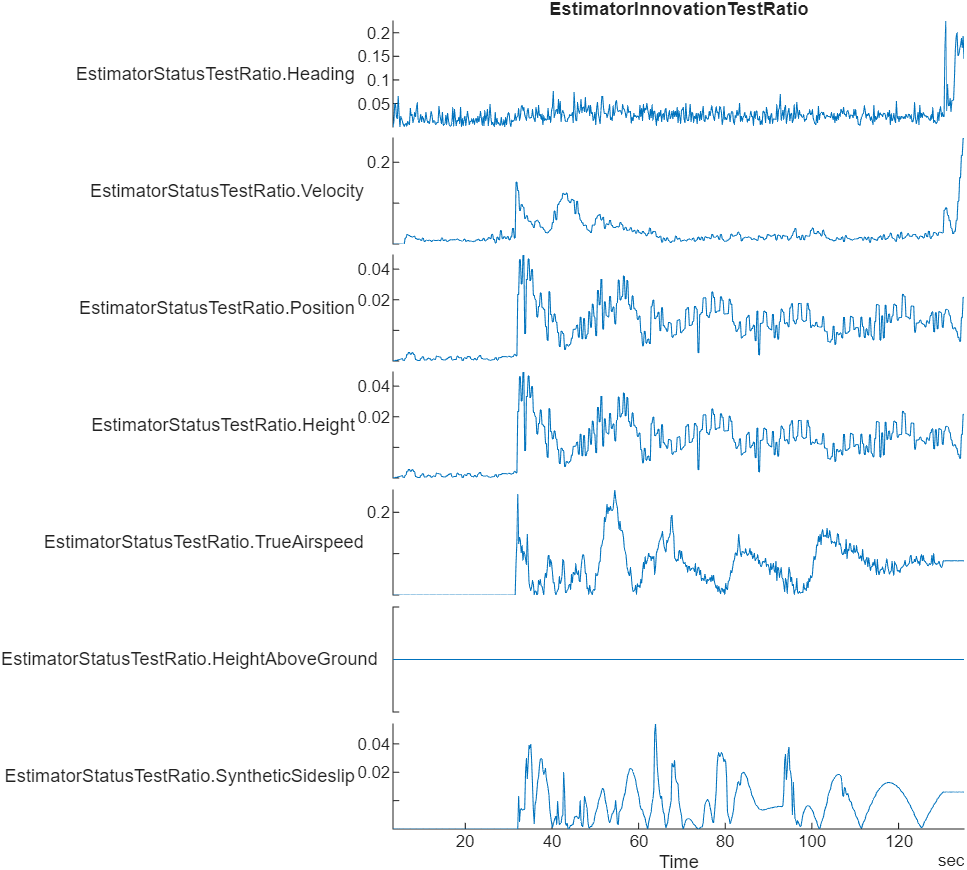
EstimatorStatusTestRatio | Low-pass filtered ratio of the largest innovation to the innovation test
limit | Heading, Velocity, Position, Height, TrueAirspeed,
HeightAboveGround, SyntheticSideslip | None |
GPS# | GPS readings for latitude, longitude, altitude, ground speed, course angle, and number of satellites visible | Latitude, Longitude, Altitude, GroundSpeed, CourseAngle,
SatellitesVisible | degree, degree, m, m/s, degree, N/A |
Gyro# | Raw body angular velocity readings from IMU sensor | GyroX, GyroY, GyroZ | rad/s, rad/s, rad/s |
LocalENU | Local ENU coordinates estimated by the UAV | X, Y, Z | m, m, m |
LocalENUTarget | Target location in local ENU coordinates | XTarget, YTarget, ZTarget | m, m, m |
LocalENUVel | Local ENU velocity estimated by the UAV | VX, VY, VZ | m/s, m/s, m/s |
LocalENUVelTarget | Target velocity in local ENU coordinates | VXTarget, VYTarget, VZTarget | m/s, m/s, m/s |
LocalNED | Local NED coordinates estimated by the UAV | X, Y, Z | m, m, m |
LocalNEDTarget | Target location in local NED coordinates | XTarget, YTarget, ZTarget | m, m, m |
LocalNEDVel | Local NED velocity estimated by the UAV | VX, VY, VZ | m/s, m/s, m/s |
LocalNEDVelTarget | Target velocity in local NED coordinates | VXTarget, VYTarget, VZTarget | m/s, m/s, m/s |
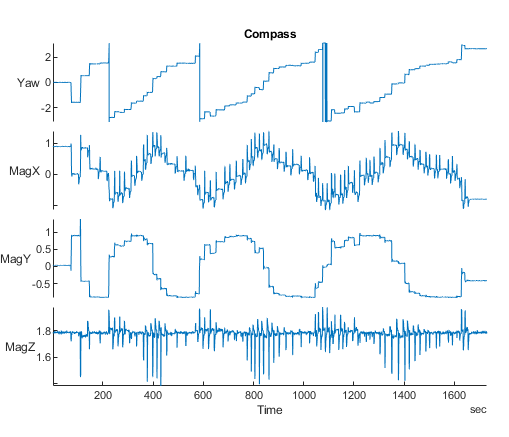
Mag# | Raw magnetometer reading from IMU sensor | MagX, MagY, MagZ | Gs, Gs, Gs |