


- /
-
2D Heat Equation
on 10 Oct 2024
- 38
- 230
- 0
- 0
- 667
Cite your audio source here (if applicable):
drawframe(1);
Write your drawframe function below
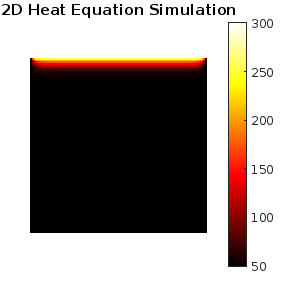
function drawframe(f)
% Parameters
Nx = 100; % Number of grid points in the x direction
Ny = 100; % Number of grid points in the y direction
Lx = 1; % Length of the plate in the x direction
Ly = 1; % Length of the plate in the y direction
dx = Lx / (Nx - 1); % Grid spacing in the x direction
dy = Ly / (Ny - 1); % Grid spacing in the y direction
alpha = 0.01; % Thermal diffusivity constant
dt = 0.001; % Time step
numFrames = 96; % Total number of frames
stepsPerFrame = 100; % Number of time steps per frame
% Initialize the temperature field
persistent T X Y
if isempty(T)
T = 50 * ones(Nx, Ny); % Temperature field (50K initially everywhere)
% Set up grid for plotting
[X, Y] = meshgrid(linspace(0, Lx, Nx), linspace(0, Ly, Ny));
% Boundary conditions
T(1, :) = 300; % Top wall heated to 300K
end
% Simulate heat diffusion for a number of time steps per frame
for t = 1:stepsPerFrame
T_new = T; % New temperature field
% Update interior points using finite difference scheme
for i = 2:Nx-1
for j = 2:Ny-1
T_new(i, j) = T(i, j) + alpha * dt * ( ...
(T(i+1, j) - 2*T(i, j) + T(i-1, j)) / dx^2 + ...
(T(i, j+1) - 2*T(i, j) + T(i, j-1)) / dy^2 );
end
end
% Update the temperature field
T = T_new;
end
% Create a figure if it doesn't exist
persistent fig h
if isempty(fig)
fig = figure('Color', 'white');
ax = axes('Parent', fig);
h = imagesc(ax, T, [50 300]); % Initialize the 2D plot (temperature values between 50K and 300K)
colorbar; % Add a colorbar to show temperature
title('2D Heat Equation Simulation');
axis off; % Remove axes for cleaner visualization
colormap('hot'); % Use 'hot' colormap for heat visualization
axis equal;
end
% Update the plot with the new temperature data
h.CData = T; % Update temperature field data for visualization
drawnow; % Refresh the plot
end
