Results for
It's been over six years since I've written any serious MATLAB code, so I thought it would be fun to see how easily ChatGPT could help me out. While others have probably already used ChatGPT to generate MATLAB code, I didn't find any evidence of it when I searched through the ThingSpeak forum. That inspired me to post an example to get people thinking about it.
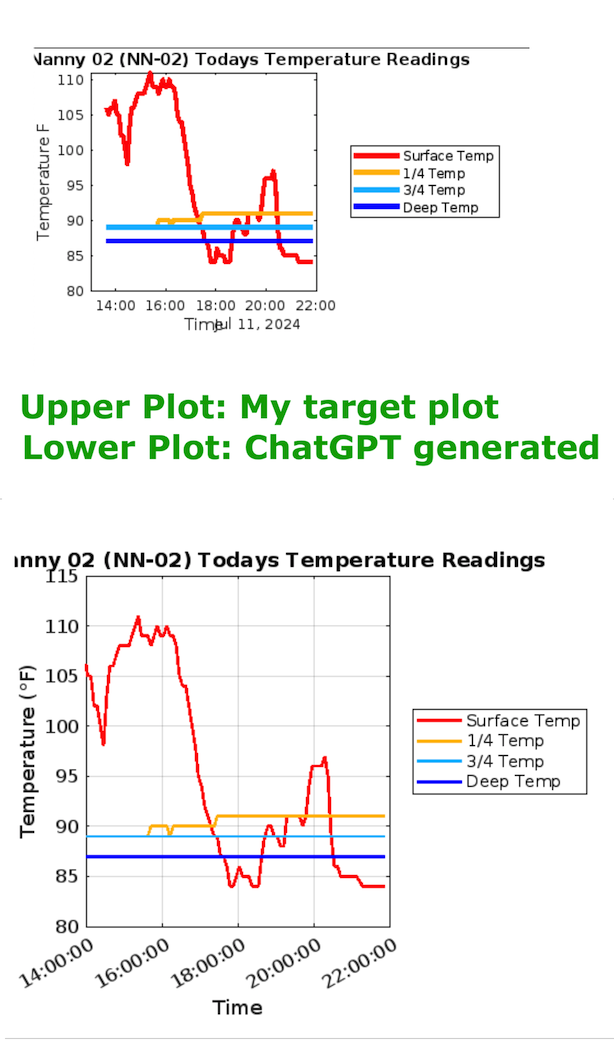
This example reads four temperature fields from the same channel and plots them on a single graph.
My ChatGPT prompt:
The prompt is pretty straightforward and essentially walks through all the elements of the chart that I wanted. It's also important to consider any filtering or "data cleansing" that should be done. Since this was my first time doing this, I decided to use an existing plot I was already familiar with as my "target state".
The prompt: "I would like you to generate some MATLAB code to create what is called a MATLAB Visualization. Its purpose will be to generate a chart of 4 fields found in a ThingSpeak channel. The ThingSpeak channel name is "Nest Nanny 2 (NN-02)" and its channel id (needed for the code) is xxxxxxx. The read api key is XXXXXXXXXXXXXXXX. The chart title should be "Nest Nanny 02 (NN-02) Todays Temperature Readings" It should plot data from 4 fields (field 3 - 6) who's names are "Surface Temp", "1/4 Temp", "3/4 Temp", and "Deep Temp". I would like the plot lines for these 4 fields to be different colors (red, orange, cyan, and blue) but on the same chart. I would like Temperature in Fahrenheit to be on the Y axis and Time on the x axis. I would like it to display the last 100 data points. I'd like to use this colororder. colororder(["#FF0000","#FFBB00","#00BBFF", "#0000FF"]) I would like the legend to be to the right of the chart, not contained within the chart. No temperature data should have a value of 50 or less and we can assume it's a sensor issue when this is observed. If a data value is 50 or less, use the value of it's nearest (in the time series) non-zero, non-negative value for that field. The data is stored in the channel as Fahrenheit and does not need to be converted from Celsius. "
Because I did this exercise using an existing plot and had a clear objective in mind, it was relatively quick to iterate four or five times with ChatGPT to refine my prompt. In just a few minutes, the generated plot almost perfectly matched my existing plot. (I xxxx'ed out the channel ID and API key before posting.) For someone who now only occasionally uses MATLAB, this approach saves time and will hopefully allow me to tap into elements of MATLAB that are now beyond my skill level and memory. ;)
ChatGPT generated MATLAB code:
% MATLAB code to create a ThingSpeak Visualization for temperature readings
% Define channel ID and Read API Key
channelID = xxxxxxx;
readAPIKey = 'XXXXXXXXXXXXXXXX';
% Number of data points to retrieve
numPoints = 100;
% Read data from the ThingSpeak channel for fields 3 to 6
[data, time] = thingSpeakRead(channelID, ...
'Fields', [3 4 5 6], ...
'NumPoints', numPoints, ...
'ReadKey', readAPIKey);
% Replace any value 50 or less with the nearest non-zero, non-negative value
for i = 1:size(data, 2)
% Identify indices where the data is 50 or less
badIndices = find(data(:,i) <= 50);
% Identify indices where the data is valid (greater than 50)
validIndices = find(data(:,i) > 50);
% Interpolate to replace bad values
if ~isempty(validIndices)
data(badIndices, i) = interp1(validIndices, data(validIndices, i), badIndices, 'linear', 'extrap');
end
end
% Plot the data
figure;
colororder(["#FF0000","#FFBB00","#00BBFF", "#0000FF"]); % Set the color order
plot(time, data(:,1), 'LineWidth', 2); hold on;
plot(time, data(:,2), 'LineWidth', 2);
plot(time, data(:,3), 'LineWidth', 2);
plot(time, data(:,4), 'LineWidth', 2);
hold off;
% Add labels and title
xlabel('Time');
ylabel('Temperature (°F)');
title('Nest Nanny 02 (NN-02) Todays Temperature Readings');
% Add legend and move it to the right of the chart
legend({'Surface Temp', '1/4 Temp', '3/4 Temp', 'Deep Temp'}, ...
'Location', 'eastoutside');
% Format the time on the x-axis
datetick('x', 'HH:MM:SS', 'keepticks');
grid on;
% Adjust the figure for better readability
set(gca, 'FontSize', 12);
Plot Comparison:
I am creating an ESP32 device which will upload data to thingspeak channel and I want the data to be displayed on my website after login. I have succesfully completed the first part of uploading the data to thingspeak. Any suggestions with second part will be very much appreciated.
Hi,
I tried several times to clear my channel data.
I would expect, when I click on Channel settings-clear channel all data from the channel is gone.
For me the data stay in. Delete channel works fine.
Is there a trick?
many thanks for your help
HEP
I'm almost embarressed enough to not ask this. :) I assumed sorting the "Updated" column in the "My Channels" view would sort my channels based on when data was last written to (last updated to) the channel
However, I have channels that have received date in August and yet the date/time stamp in the Uodated column displays a June date and therefore they sort in the wrong order. Does "update" mean something other than a data update, such as a settings update? If so, if there a way to sort the channels by the more recent data update?
With a deployment of ThingSpeak on August 15th, 2024, we are using a new library for visualization of ThingSpeak channel charts. This should require no changes on your part. If you notice any discrepancies/differences in your channel visualization, please post a screenshot on this thread.
Imagine that the earth is a perfect sphere with a radius of 6371000 meters and there is a rope tightly wrapped around the equator. With one line of MATLAB code determine how much the rope will be lifted above the surface if you cut it and insert a 1 meter segment of rope into it (and then expand the whole rope back into a circle again, of course).
Due to API changes at X, formerly known as Twitter, the integration between ThingSpeak and X, specifically the ThingTweet functionality, was not operational for a number of months. As of August 1st, 2024, the ThingTweet functionality is being deprecated.
The alternative, which requires manual steps due to X requiring manual application for a developer account, is to use the TWITTER function from Datafeed toolbox in MATLAB code. You can then create a React that is associated with this MATLAB code to post to X.
hello i found the following tools helpful to write matlab programs. copilot.microsoft.com chatgpt.com/gpts gemini.google.com and ai.meta.com. thanks a lot and best wishes.
I use "x = ThingSpeak.writeFields(myChannelNumber1, myWriteAPIKey1);" in my code to update the ThingSpeak channel. 4 fields are associated with this channel. This statement is executed about once every 5 minutes.
Roughly 60% of the time, I got an error message "HTTP error code -301". The other 40% of time the channel update is successful. What does the "HTTP error code -301" mean? Any suggestion on how to improve the success rate of the channel update
Check out the LLMs with MATLAB project on File Exchange to access Large Language Models from MATLAB.
Along with the latest support for GPT-4o mini, you can use LLMs with MATLAB to generate images, categorize data, and provide semantic analyis.
function ans = your_fcn_name(n)
n;
j=sum(1:n);
a=zeros(1,j);
for i=1:n
a(1,((sum(1:(i-1))+1)):(sum(1:(i-1))+i))=i.*ones(1,i);
end
disp
I am trying to earn my Intro to MATLAB badge in Cody, but I cannot click the Roll the Dice! problem. It simply is not letting me click it, therefore I cannot earn my badge. Does anyone know who I should contact or what to do?
Problem statement: I've written a visualization that I'd like to use on potentially hundreds of different channels in my commerical account. Because it contains code that's unique to the channel (channel id, read API key, etc.) I have to create and maintain a duplicate visualization for each channel. This is wasteful, a source of errors, and almost intractable for a commercial customer with a high channel count.
My request is that MATLAB Visualizations be extended to support parameters, but only a predefined set to reduce the scope. I would propose a subset of the parameters currently supported by the ThingSpeak API. For example, thingSpeakRead supports (requires) readChannelID, NumPoints, and a ReadKey etc. If those were elevated to also be allowed as Visualization parameters, I imagine it would satisfy a large subset of user needs.
The poor man's version of this would be if ThingSpeak supported just one special parameter, such as %CHANNEL_ID%. If this was available within the visualization code one could use it as a key into table to get the other pieces of data like API keys, etc. It would be have to be passed on the visualization url (https://thingspeak.com/apps/matlab_visualizations/573779?readChannelID=xxxxx). Not sure how the visualization would pick it up in the use case where it's called from the ThingSpeak website under the user's list of MATLAB Visualizations. Perhaps it can be prompted for.
I initially considered user defined functions or libraries but they are not supported and I can see that that would require even more development work to support. The workarounds described in this thread aren't suitable for me. https://www.mathworks.com/matlabcentral/answers/2102981-how-to-use-private-functions-lib-in-thingspeak?s_tid=srchtitle_community_thingspeak_14_libraries
thanks!
Tom
how can I link a chinese flow meter to this website
Die Anzeige der Werte in den einzelnen Feldern ist nicht aktuell.
So werden z.B. um 18:00 Uhr nur die Werte bis 14:00 Uhr angezeigt, auch das verändern des Zeitfensters bringt keine Abhilfe.
Hat jemand eine Idee wie ich die der Uhrzeit ensprechenden Werte zur Anzeige bringe.
Die Werte werden von Shellies und BitShake kontinuierlich übertragen.
My thingSpeak channel kept on updateing the same signal as early eventhough my simulink have update the new signal. How to solve this?
Hi ThingSpeak Community,
I hope you are all doing well.
I am currently setting up a Vodafone ACL for a SIM card that will be used in a device destined for a remote charity deployment in a week. The goal is to ensure that the device can reliably upload data to ThingSpeak without any connectivity issues.
Here are the details of my current ACL setup:
- FQDN: api.thingspeak.com (specified as the API endpoint)
- IPv4 Address: 184.106.153.149 (found online)
- Port: (left empty)
I've attached a photo of the setup for reference.
Could you please confirm if the above ACL settings are correct? Additionally, if there are any other considerations or settings I should be aware of for ensuring reliable connectivity with ThingSpeak, I would greatly appreciate your guidance.
Currently, all I am using for the device credentials is the PIN number. Do I need to adjust any settings in the Arduino code or the ACL to maintain stable connectivity with ThingSpeak, especially considering the device will be in a remote location and difficult to access for adjustments?
Your prompt assistance and advice will be immensely valuable, as I want to ensure everything is correctly configured before deployment.
Thank you very much!
Best regards,
Arthur
What do you think about the NVIDIA's achivement of becoming the top giant of manufacturing chips, especially for AI world?

Twitch built an entire business around letting you watch over someone's shoulder while they play video games. I feel like we should be able to make at least a few videos where we get to watch over someone's shoulder while they solve Cody problems. I would pay good money for a front-row seat to watch some of my favorite solvers at work. Like, I want to know, did Alfonso Nieto-Castonon just sit down and bang out some of those answers, or did he have to think about it for a while? What was he thinking about while he solved it? What resources was he drawing on? There's nothing like watching a master craftsman at work.
I can imagine a whole category of Cody videos called "How I Solved It". I tried making one of these myself a while back, but as far as I could tell, nobody else made one.
Here's the direct link to the video: https://www.youtube.com/watch?v=hoSmO1XklAQ
I hereby challenge you to make a "How I Solved It" video and post it here. If you make one, I'll make another one.
The Ans Hack is a dubious way to shave a few points off your solution score. Instead of a standard answer like this
function y = times_two(x)
y = 2*x;
end
you would do this
function ans = times_two(x)
2*x;
end
The ans variable is automatically created when there is no left-hand side to an evaluated expression. But it makes for an ugly function. I don't think anyone actually defends it as a good practice. The question I would ask is: is it so offensive that it should be specifically disallowed by the rules? Or is it just one of many little hacks that you see in Cody, inelegant but tolerable in the context of the surrounding game?
Incidentally, I wrote about the Ans Hack long ago on the Community Blog. Dealing with user-unfriendly code is also one of the reasons we created the Head-to-Head voting feature. Some techniques are good for your score, and some are good for your code readability. You get to decide with you care about.