Results for
The Ans Hack is a dubious way to shave a few points off your solution score. Instead of a standard answer like this
function y = times_two(x)
y = 2*x;
end
you would do this
function ans = times_two(x)
2*x;
end
The ans variable is automatically created when there is no left-hand side to an evaluated expression. But it makes for an ugly function. I don't think anyone actually defends it as a good practice. The question I would ask is: is it so offensive that it should be specifically disallowed by the rules? Or is it just one of many little hacks that you see in Cody, inelegant but tolerable in the context of the surrounding game?
Incidentally, I wrote about the Ans Hack long ago on the Community Blog. Dealing with user-unfriendly code is also one of the reasons we created the Head-to-Head voting feature. Some techniques are good for your score, and some are good for your code readability. You get to decide with you care about.
Hi All,
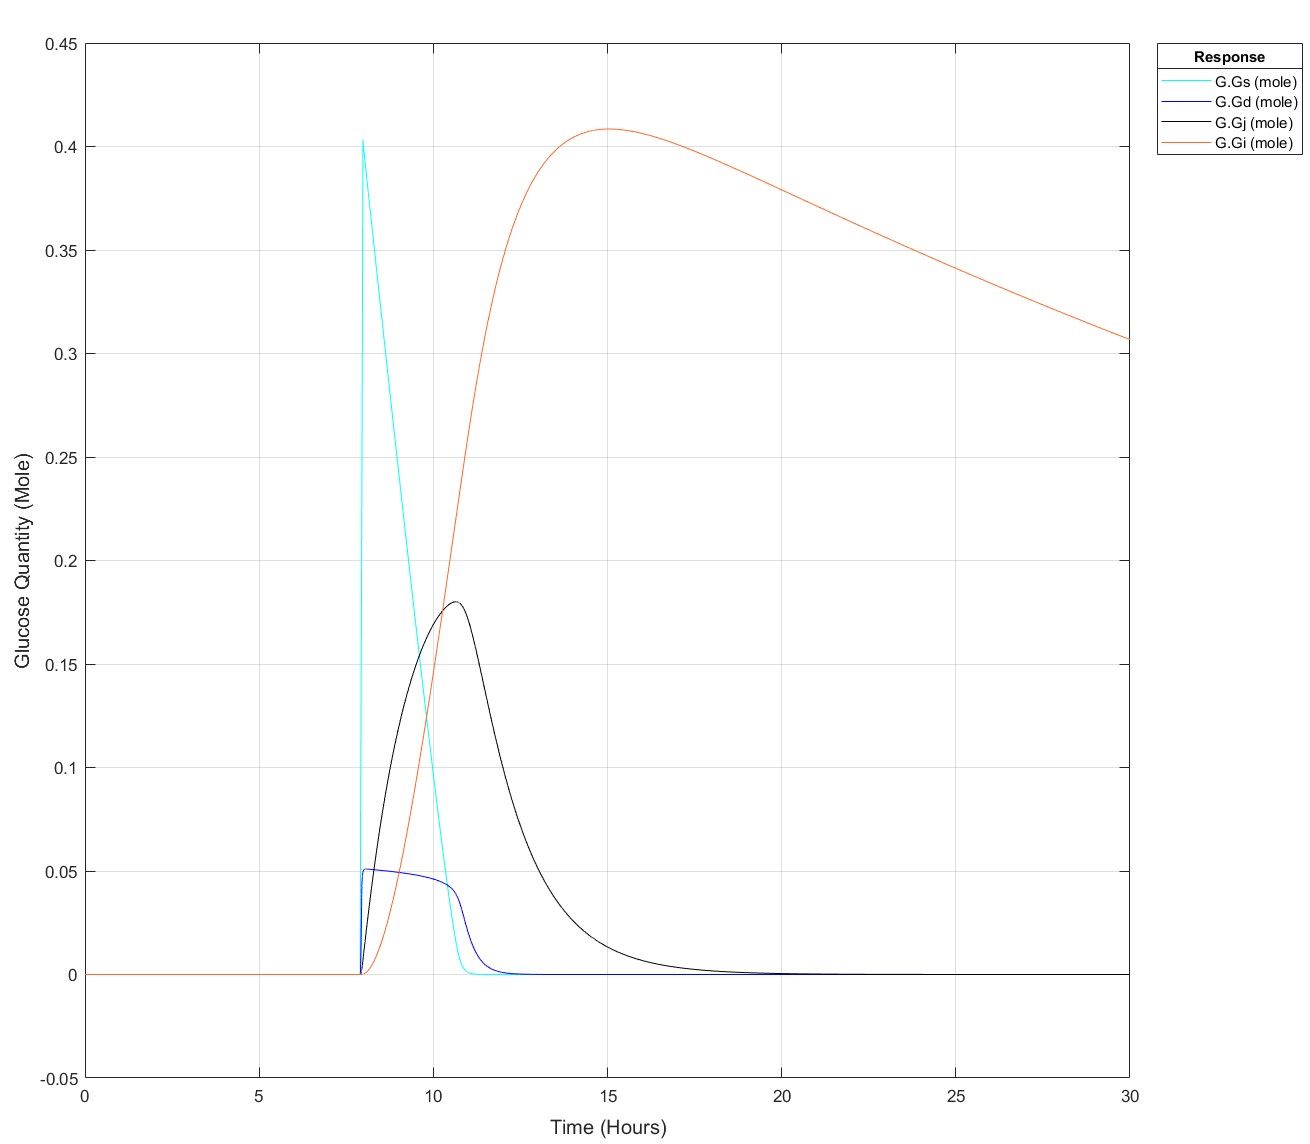
I've been producing a QSP model of glucose homeostasis for a while now for my PhD project, recently I've been able to expand it to larger time series, i.e. 2 days of data rather than a singular injection or a singular meal. My problem is as follows: If I put 75g of glucose into my stomach glucose species any later than (exactly) 8.5 hours I get an integration tolerance error. Curiosly, I can put 25g of glucose in at any time up to 15.9 hours, then any later an error. I have disabled all connections to my glucose absorption chain, i.e. stomach -> duodenum -> jenenum -> ileum -> removal, to isolate the cause of this. I had initially thought it may be because I mechanistically model liver glycogen and that does deplete over time, but I've tested enough to show that that does nothing. My next test is to isolate the glucose absorption chain into a seperate model and see if the issue persists but I'm completely baffled!
These are the equations, to my eye there's no reason why there would be such a sharp glucose quantity/time dependence, they all begin at a value of 0:
d(Gs)/dt = -(kw*(1-Gd^14/(Igd^14+Gd^14))*Gs) #Stomach glucose
d(Gd)/dt = (kw*(1-Gd^14/(Igd^14+Gd^14))*Gs) - (kdj*Gd) #Duodenal Glucose
d(Gj)/dt = (kdj*Gd) - (kji*Gj) #Jejunal Glucose
d(Gi)/dt = (kji*Gj) - (kic*Gi) #Ileal Glucose
(The sigmoidicity of gastric emptying slowing term (^14) was parameterised off of paracetamol absorption data and appears to be correct!)
Thank you for your help, best regards,
Dan
Pre-Edit: I changed the run time to 30 hours and now I can't use the 75g input any later than 7.9 hours not 8.5 hours anymore!
Edit: This is how it appears at all times prior to it failing for 75g:
There are a host of problems on Cody that require manipulation of the digits of a number. Examples include summing the digits of a number, separating the number into its powers, and adding very large numbers together.
If you haven't come across this trick yet, you might want to write it down (or save it electronically):
digits = num2str(4207) - '0'
That code results in the following:
digits =
4 2 0 7
Now, summing the digits of the number is easy:
sum(digits)
ans =
13
Hello and a warm welcome to everyone! We're excited to have you in the Cody Discussion Channel. To ensure the best possible experience for everyone, it's important to understand the types of content that are most suitable for this channel.
Content that belongs in the Cody Discussion Channel:
- Tips & tricks: Discuss strategies for solving Cody problems that you've found effective.
- Ideas or suggestions for improvement: Have thoughts on how to make Cody better? We'd love to hear them.
- Issues: Encountering difficulties or bugs with Cody? Let us know so we can address them.
- Requests for guidance: Stuck on a Cody problem? Ask for advice or hints, but make sure to show your efforts in attempting to solve the problem first.
- General discussions: Anything else related to Cody that doesn't fit into the above categories.
Content that does not belong in the Cody Discussion Channel:
- Comments on specific Cody problems: Examples include unclear problem descriptions or incorrect testing suites.
- Comments on specific Cody solutions: For example, you find a solution creative or helpful.
Please direct such comments to the Comments section on the problem or solution page itself.
We hope the Cody discussion channel becomes a vibrant space for sharing expertise, learning new skills, and connecting with others.
Join us for a hands-on workshop focussing on Global Sensitivity Analysis (GSA) for QSP using SimBiology. This complimentary session aims to give you theoretical background and hands-on experience with GSA methods.
🗓️ Event Details: June 25, 1-5pm CEST @PAGE 2024, Rome
🔖 Registration: Free, but space is limited. Early registration is recommended to ensure your place in this workshop.
For more details and to register, please visit https://www.mathworks.com/company/events/seminars/global-sensitivity-analysis-with-simbiology-4361208.html
Hi All,
I'm trying to produce some nice figures from the graphical user interface and have a set of local sensitivity analyses that I'd like to combine.
I have two inputs that vary the sensitivies of my system and would like to plot them on top of each other like:
Is there either a way to do this natively in simbiology (when you try and use 'keep results from each run' it plots them both as a time series) or to export the sensitivity data to the normal matlab programatic UI where I can combine them by hand?
Thank you for your help!
Hi All,
I'm trying to plot my observables in the analyzer and running into far more problems than expected. I have two species in my model that are invovled, blood.Insulin (pM) and blood.Glucose (mM), all I want to do is plot the ratio of these two (blood.Insulin/blood.Glucose (dimensionless)) along with my other species in Model Simulation, to compare it to the same ratio from my data.
First, there doesn't seem to be a way to directly add an observable to the logged states in 'Simulate Model', so I've tried to used 'Calculate Observable' based on the data from my last run (IVGTT.LastRun.results) but it says that units are required when unit conversion is enabled, but it should be dimensionless!
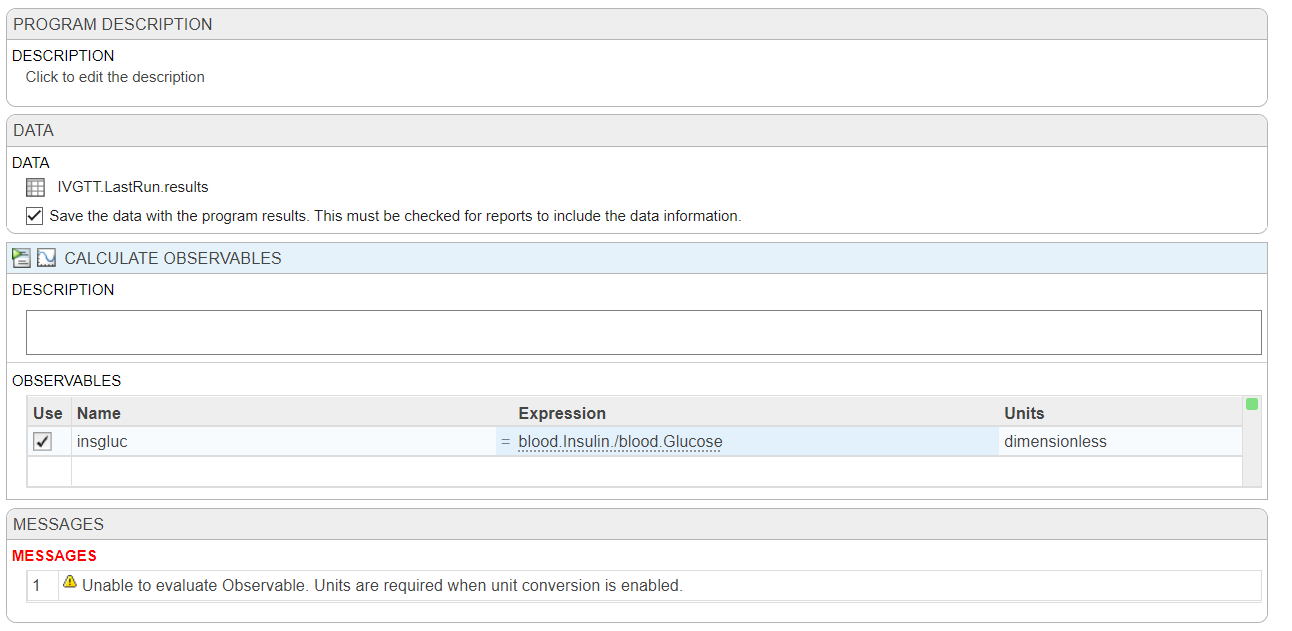
My next idea would be to make a non-constant parameter with a repeated assignment, but I feel like I should be able to do this without resorting to that?
Any help or ideas would be appreciated. Thank you, best regards,
Dan
I based my model construction on this PBPK model: PBPK by Armin Sepp. While this is a very convenient script for building a PBPK two-pore model, it's very incovenient for my application to have the species Units defined in molarity. Is there a convenient way to organically switch this model from molarity to grams (or any weight unit)?

I'm having problem in its test 6 ... passing 5/6 what would be the real issue..
am wring Transformation matrix correct.. as question said SSW should be 202.5 degree...
so what is the issue..
Hi! I'm new to pk modeling and Matlab. Can someone guide me through how to conduct population pk modeling based on pk parameters from non-human primate studies? Much thanks!!!!
The title is resonably non-descript, but I can explain it easily:
Say I have an initial Emax model:
v = emax1*[G]^n1/(ec501^n1+[G]^n1)
And I want to place v inside of a second Emax model:
y = emax2*v^n2/(ex502^n2+v^n2)
Currently, I have the full function of v inside y, twice, it's very long and whilst I only need to get it correct once, for readability in the future I'd rather have it in form #2. I've played around with non-constant parameters but I need the steady state to be v, not the rate rule, and I haven't worked out how to make a parameter shift to a form like v, as an observation might.
Are there any recommended solutions or do I simply need to keep with having v fully expressed in y?
Thank you,
Dan
Hi All,
I'm currently attempting to implement a Hodgkin-Huxley-type model of membrane potential, ideally I would like a species that represents the membrane potential as its own distinct entity, so as the reference elsewhere. I've currently established a molarity-based work around but it would be great if I could set the units for the species as millivolt, but that throws an error.
Is there an established way to do this? I imagine I'm not the first person to be trying to model a voltage-gated ion channel!
Thank you for your help.
Hello,
I've looked around and I haven't found anything obvious about this, but is it possible to link to species/reactions, graphically, in a non-mass transfer sense? I have areas in my model where it would conceptually make sense to be able to see that species or reactions are linked, but if I link them in the standard way it demands that it be involved in the stoichiometry.
Perhaps some kind of dotted line, or similar?
Thank you, best regards,
Dan
Hello all,
I've been trying to shift my workflow more towards simbiology, it has a lot of very interesting features and it makes sense to try and do everything in one place if it works well..! Part of my hesitancy into this was some bad experiences handling units in the past, though this was almost certainly all out of my own ignorance, relatedly:
Getting onto my question.
In this model I have a species traveling around the body via blow flow, think a basic PBPK model. My species are picomolarities, if everything is already in concentrations, why is it necessary to initially divide by the compartment volume? i.e. 1/Pancreas below.

If my model dealt in molar quantities this would make a lot of sense, the division would represent the transition to concentrations. This, however, now necessitates my parameters be in units of liter/minute, which is actually correct, but I'd like clarification on why it's correct, ha!
Perhaps this is more of a modelling question than a simbiology question, but if there are answers I'd love to hear them. Thanks!
Hi All,
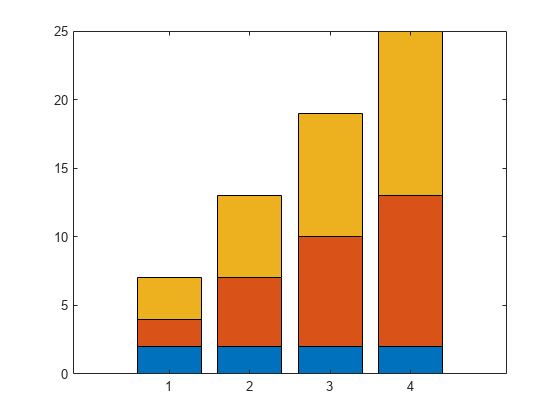
I'm attempting to put a set of simbiology global sensitivity analysis plots into my thesis and I'm running into some issues with the GSA plots. Firstly, the figures are very large, it would be quite beneficial to grab a set of the plots and arrange them myself, is there any documentation on how to mess around with the '1x1 Sobol' produced by sbiosobol? Or just GSA plots in general.
The second problem is that the results appear to be relative to the most sensitive parameter in that run. Is it recommended to have a resonably sensitive 'baseline' parameter in each run? I find it difficult to compare plots when a not so sensitive parameter is being recorded as near '1' for the whole run because it's being stacked against a set of very insensitive parameters. I.e. if i have multiple sets of GSAs due to a large model, how can I easily compare results? If I could do some single run through with every parameter that would be the ideal, I imagine, but then the default plot would be half a mile off the bottom of my screen, haha! Perhaps there is a solution to the first question that might help there?
Thank you for your help,
Dan
Thats the task:
Given a square cell array:
x = {'01', '56'; '234', '789'};
return a single character array:
y = '0123456789'
I wrote a code that passes Test 1 and 2 and one that passes Test 3 but I'm searching a condition so that the code for Test 3 runs when the cell array only contains letters and the one for Test 1 and 2 in every other case. Can somebody help me?
This is my code:
y = []
[a,b]=size(x)
%%TEST 3
delimiter=zeros(1,a)
delimiter(end)=1
delimiter=repmat(delimiter,1,b)
delimiter(end)=''
delimiter=string(delimiter)
y=[]
for i=1:a*b
y = string([y x(i)])
end
y=join(y,delimiter)
y=erase(y,'0')
y=regexprep(y,'1',' ')
%%TEST 1+2
for i=1:a*b
y = string([y x(i)])
y=join(y)
end
y=erase(y,' ' )
That's the question: Given four different positive numbers, a, b, c and d, provided in increasing order: a < b < c < d, find if any three of them comprise sides of a right-angled triangle. Return true if they do, otherwise return false .
I wrote this code but it doesn't pass test 7. I don't really understand why it isn't working. Can somebody help me?
function flag = isTherePythagoreanTriple(a, b, c, d)
a2=a^2
b2=b^2
c2=c^2
d2=d^2
format shortG
if a2+b2==c2
flag=true
else if a2+b2==d2
flag=true
else if a2+c2==d2
flag=true
else if c2+b2==d2
flag=true
else flag=false
end
end
end
end
end
That's the question:
The file cars.mat contains a table named cars with variables Model, MPG, Horsepower, Weight, and Acceleration for several classic cars.
Load the MAT-file. Given an integer N, calculate the output variable mpg.
Output mpg should contain the MPG of the top N lightest cars (by Weight) in a column vector.
I wrote this code and the resulting column vector has the right values but it doesn't pass the tests. What's wrong?
function mpg = sort_cars(N)
load cars.mat
sorted=sortrows(cars,4)
mpg = sorted(1:N,2)
end
Hi all,
I've translated a model from another piece of software (monolix) into simbio programmatically to make use of your very easy global sensitivity analysis system.
It looks a little something like this, for a 'single' line example:
r1 = addreaction(model,'InsI -> InsP');
r1.ReactionRate = 'InsI*kip/vi'; %- is + panc
k1 = addkineticlaw(r1, 'Unknown');
Multiplied about 20 fold, as you can see I have included my volumes within the reaction rates myself (vi). The model functions perfectly and I have corrected the outputs at the end:
[time, x, names] = sbiosimulate(model,csObj,dObj1);
x(:,1) = x(:,1)/vi;
So that they are in concentration, as needed. However, when it comes to sensitivity analysis because I have corrected them post-model it is technically incorrect, it is analysing the absolute quantities. This is quite noticible in the sensitivity to the volumes.
Is there an easy fix to this, I've had to fight dimensionality with units in the past using simbio and I'd be great if there was some way of dividing a compartment output by a volume, for example. It is a functionality that exists in monolix, so I was hopeful it might here!
Thank you for your time.
EDIT:
I think I've worked it out, I had to refactor my model to operate in concentrations, just refitting it now. Now I should just be able to use unitless compartments.
I am trying to simulate model of blood lymphocyte count from a paper using Simbiology. The rate of in or out following circadian rythym is kp(t)=km + kb cos [(t-tpeak)*2pi/24] Where and how do I write the expression ? I dont think I can write in repeated assignment ?